Osage vs Immigrants from Burma/Myanmar Householder Income Over 65 years
COMPARE
Osage
Immigrants from Burma/Myanmar
Householder Income Over 65 years
Householder Income Over 65 years Comparison
Osage
Immigrants from Burma/Myanmar
$55,677
HOUSEHOLDER INCOME OVER 65 YEARS
0.4/ 100
METRIC RATING
252nd/ 347
METRIC RANK
$57,114
HOUSEHOLDER INCOME OVER 65 YEARS
1.7/ 100
METRIC RATING
234th/ 347
METRIC RANK
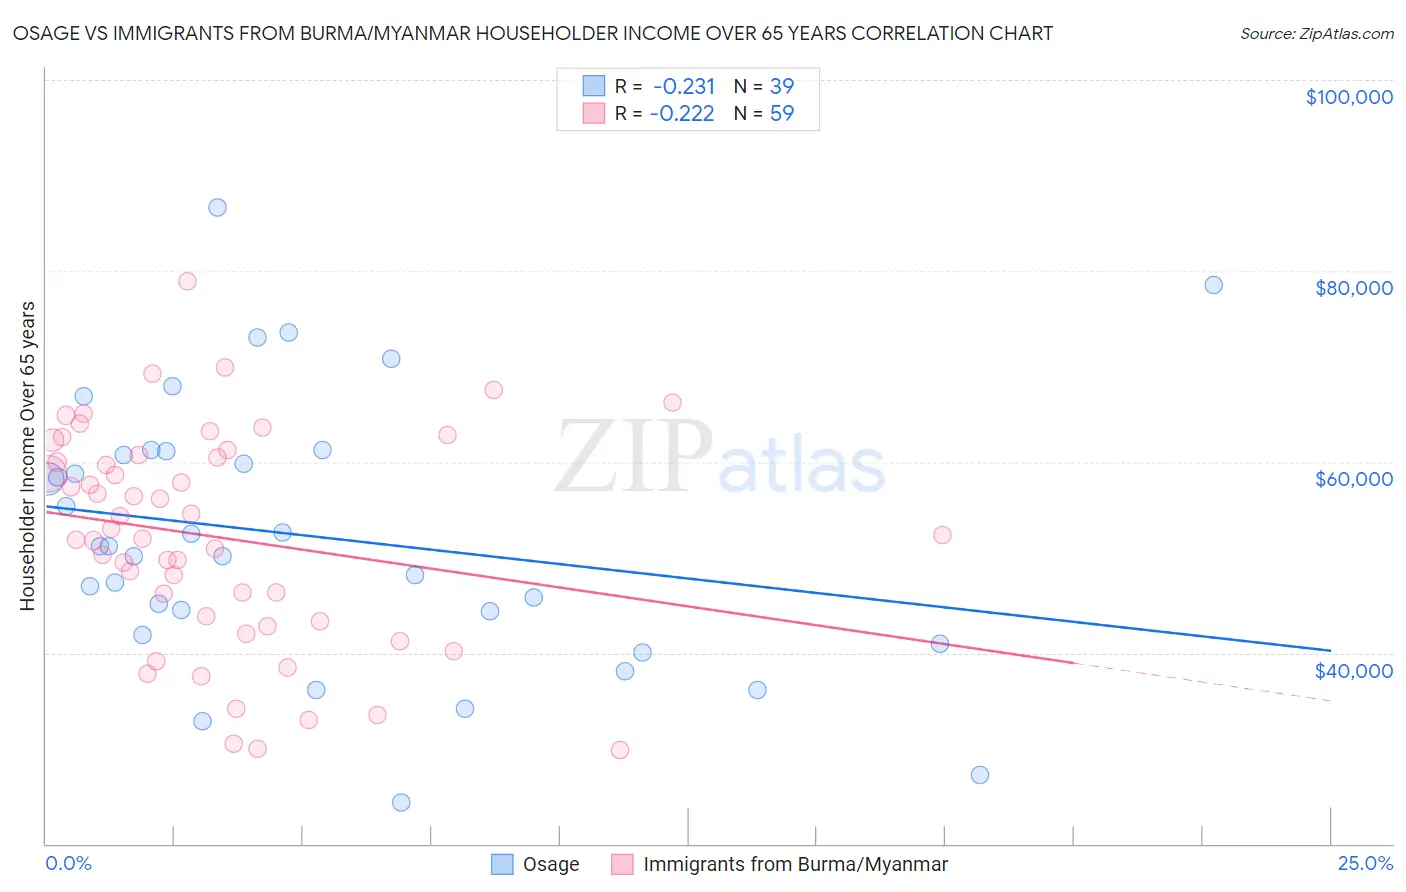
Osage vs Immigrants from Burma/Myanmar Householder Income Over 65 years Correlation Chart
The statistical analysis conducted on geographies consisting of 91,730,498 people shows a weak negative correlation between the proportion of Osage and household income with householder over the age of 65 in the United States with a correlation coefficient (R) of -0.231 and weighted average of $55,677. Similarly, the statistical analysis conducted on geographies consisting of 172,033,501 people shows a weak negative correlation between the proportion of Immigrants from Burma/Myanmar and household income with householder over the age of 65 in the United States with a correlation coefficient (R) of -0.222 and weighted average of $57,114, a difference of 2.6%.
Householder Income Over 65 years Correlation Summary
| Measurement | Osage | Immigrants from Burma/Myanmar |
| Minimum | $24,375 | $29,861 |
| Maximum | $86,625 | $78,969 |
| Range | $62,250 | $49,108 |
| Mean | $52,145 | $52,112 |
| Median | $51,151 | $52,321 |
| Interquartile 25% (IQ1) | $41,874 | $43,364 |
| Interquartile 75% (IQ3) | $61,145 | $60,699 |
| Interquartile Range (IQR) | $19,271 | $17,335 |
| Standard Deviation (Sample) | $14,116 | $11,315 |
| Standard Deviation (Population) | $13,934 | $11,219 |
Demographics Similar to Osage and Immigrants from Burma/Myanmar by Householder Income Over 65 years
In terms of householder income over 65 years, the demographic groups most similar to Osage are Immigrants from Trinidad and Tobago ($55,598, a difference of 0.14%), Immigrants from Portugal ($55,924, a difference of 0.44%), Immigrants from Bosnia and Herzegovina ($55,986, a difference of 0.55%), Mexican American Indian ($56,089, a difference of 0.74%), and Vietnamese ($56,143, a difference of 0.84%). Similarly, the demographic groups most similar to Immigrants from Burma/Myanmar are Immigrants from Western Africa ($57,119, a difference of 0.010%), Spanish American ($57,021, a difference of 0.16%), Immigrants from Uruguay ($56,975, a difference of 0.24%), Immigrants from Panama ($56,944, a difference of 0.30%), and Fijian ($56,768, a difference of 0.61%).
| Demographics | Rating | Rank | Householder Income Over 65 years |
| Immigrants | Western Africa | 1.7 /100 | #233 | Tragic $57,119 |
| Immigrants | Burma/Myanmar | 1.7 /100 | #234 | Tragic $57,114 |
| Spanish Americans | 1.6 /100 | #235 | Tragic $57,021 |
| Immigrants | Uruguay | 1.5 /100 | #236 | Tragic $56,975 |
| Immigrants | Panama | 1.5 /100 | #237 | Tragic $56,944 |
| Fijians | 1.2 /100 | #238 | Tragic $56,768 |
| Immigrants | Laos | 1.2 /100 | #239 | Tragic $56,722 |
| Sub-Saharan Africans | 1.0 /100 | #240 | Tragic $56,615 |
| Immigrants | Guyana | 0.9 /100 | #241 | Tragic $56,495 |
| Yaqui | 0.8 /100 | #242 | Tragic $56,417 |
| Guyanese | 0.8 /100 | #243 | Tragic $56,351 |
| Hmong | 0.8 /100 | #244 | Tragic $56,339 |
| Immigrants | Uzbekistan | 0.8 /100 | #245 | Tragic $56,331 |
| Central Americans | 0.8 /100 | #246 | Tragic $56,321 |
| Yakama | 0.7 /100 | #247 | Tragic $56,234 |
| Vietnamese | 0.6 /100 | #248 | Tragic $56,143 |
| Mexican American Indians | 0.6 /100 | #249 | Tragic $56,089 |
| Immigrants | Bosnia and Herzegovina | 0.5 /100 | #250 | Tragic $55,986 |
| Immigrants | Portugal | 0.5 /100 | #251 | Tragic $55,924 |
| Osage | 0.4 /100 | #252 | Tragic $55,677 |
| Immigrants | Trinidad and Tobago | 0.4 /100 | #253 | Tragic $55,598 |