Immigrants from Northern Africa vs Immigrants from Burma/Myanmar Householder Income Over 65 years
COMPARE
Immigrants from Northern Africa
Immigrants from Burma/Myanmar
Householder Income Over 65 years
Householder Income Over 65 years Comparison
Immigrants from Northern Africa
Immigrants from Burma/Myanmar
$62,522
HOUSEHOLDER INCOME OVER 65 YEARS
83.6/ 100
METRIC RATING
133rd/ 347
METRIC RANK
$57,114
HOUSEHOLDER INCOME OVER 65 YEARS
1.7/ 100
METRIC RATING
234th/ 347
METRIC RANK
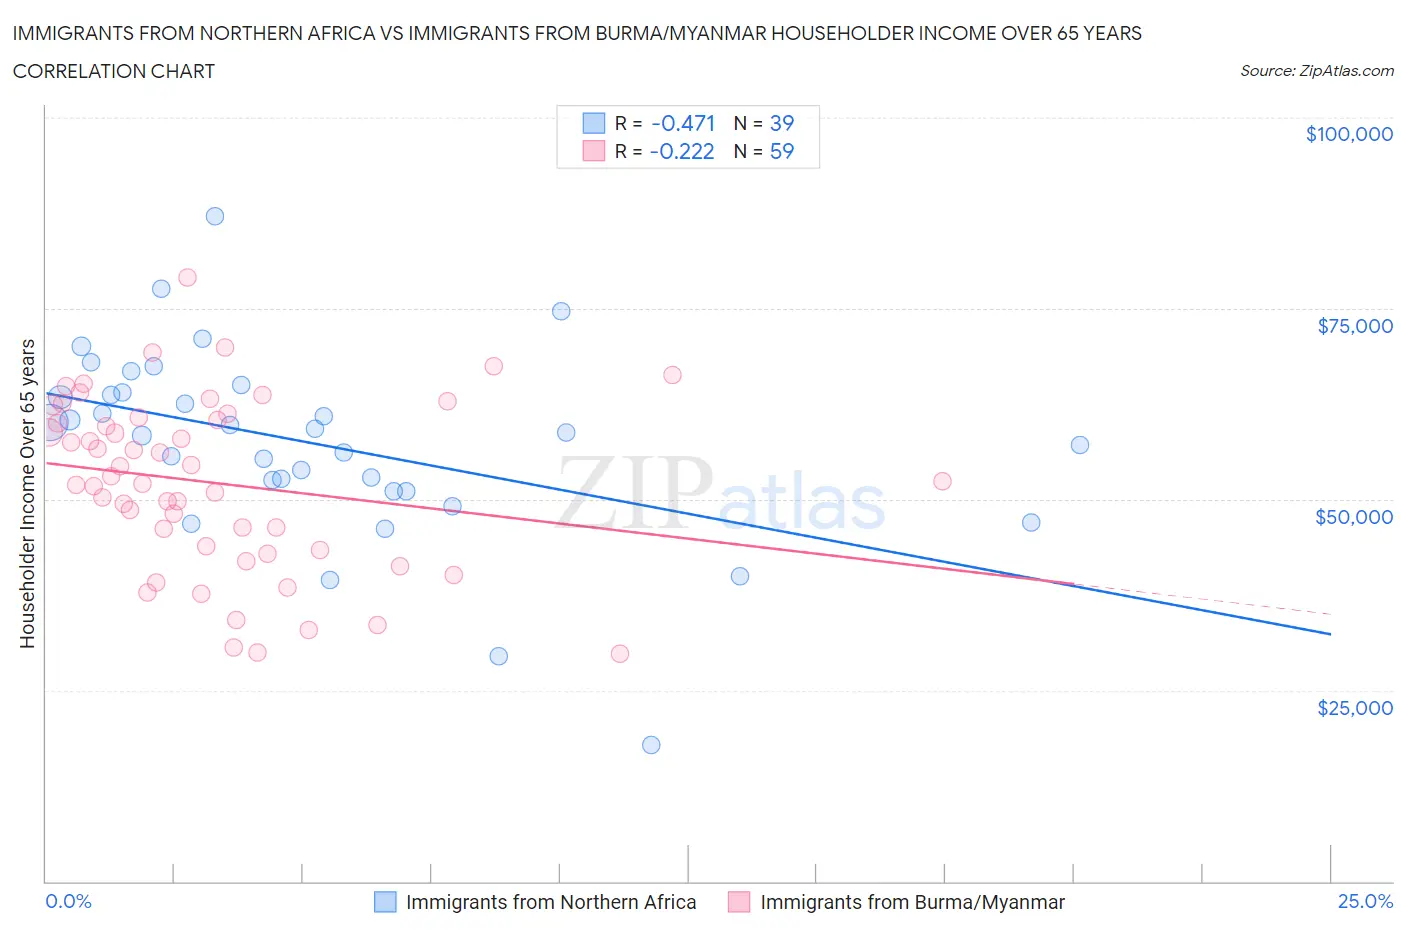
Immigrants from Northern Africa vs Immigrants from Burma/Myanmar Householder Income Over 65 years Correlation Chart
The statistical analysis conducted on geographies consisting of 320,603,488 people shows a moderate negative correlation between the proportion of Immigrants from Northern Africa and household income with householder over the age of 65 in the United States with a correlation coefficient (R) of -0.471 and weighted average of $62,522. Similarly, the statistical analysis conducted on geographies consisting of 172,033,501 people shows a weak negative correlation between the proportion of Immigrants from Burma/Myanmar and household income with householder over the age of 65 in the United States with a correlation coefficient (R) of -0.222 and weighted average of $57,114, a difference of 9.5%.
Householder Income Over 65 years Correlation Summary
| Measurement | Immigrants from Northern Africa | Immigrants from Burma/Myanmar |
| Minimum | $17,788 | $29,861 |
| Maximum | $87,122 | $78,969 |
| Range | $69,334 | $49,108 |
| Mean | $57,290 | $52,112 |
| Median | $58,750 | $52,321 |
| Interquartile 25% (IQ1) | $51,125 | $43,364 |
| Interquartile 75% (IQ3) | $63,952 | $60,699 |
| Interquartile Range (IQR) | $12,827 | $17,335 |
| Standard Deviation (Sample) | $12,617 | $11,315 |
| Standard Deviation (Population) | $12,454 | $11,219 |
Similar Demographics by Householder Income Over 65 years
Demographics Similar to Immigrants from Northern Africa by Householder Income Over 65 years
In terms of householder income over 65 years, the demographic groups most similar to Immigrants from Northern Africa are Immigrants from Germany ($62,544, a difference of 0.040%), Immigrants from Western Asia ($62,645, a difference of 0.20%), Basque ($62,653, a difference of 0.21%), Immigrants from Brazil ($62,364, a difference of 0.25%), and Immigrants from Eastern Europe ($62,693, a difference of 0.27%).
| Demographics | Rating | Rank | Householder Income Over 65 years |
| Peruvians | 86.8 /100 | #126 | Excellent $62,766 |
| Swedes | 86.4 /100 | #127 | Excellent $62,736 |
| Aleuts | 86.1 /100 | #128 | Excellent $62,708 |
| Immigrants | Eastern Europe | 85.9 /100 | #129 | Excellent $62,693 |
| Basques | 85.4 /100 | #130 | Excellent $62,653 |
| Immigrants | Western Asia | 85.3 /100 | #131 | Excellent $62,645 |
| Immigrants | Germany | 83.9 /100 | #132 | Excellent $62,544 |
| Immigrants | Northern Africa | 83.6 /100 | #133 | Excellent $62,522 |
| Immigrants | Brazil | 81.2 /100 | #134 | Excellent $62,364 |
| Immigrants | Chile | 81.0 /100 | #135 | Excellent $62,354 |
| Alaskan Athabascans | 80.6 /100 | #136 | Excellent $62,330 |
| Immigrants | Syria | 80.2 /100 | #137 | Excellent $62,303 |
| Immigrants | Kazakhstan | 80.0 /100 | #138 | Excellent $62,292 |
| Lebanese | 79.9 /100 | #139 | Good $62,287 |
| Arabs | 79.6 /100 | #140 | Good $62,266 |
Demographics Similar to Immigrants from Burma/Myanmar by Householder Income Over 65 years
In terms of householder income over 65 years, the demographic groups most similar to Immigrants from Burma/Myanmar are Immigrants from Western Africa ($57,119, a difference of 0.010%), Spanish American ($57,021, a difference of 0.16%), Immigrants from Uruguay ($56,975, a difference of 0.24%), Immigrants from Panama ($56,944, a difference of 0.30%), and Immigrants from Venezuela ($57,371, a difference of 0.45%).
| Demographics | Rating | Rank | Householder Income Over 65 years |
| Japanese | 3.9 /100 | #227 | Tragic $57,919 |
| Immigrants | Albania | 3.6 /100 | #228 | Tragic $57,828 |
| Immigrants | Colombia | 3.0 /100 | #229 | Tragic $57,658 |
| Immigrants | Cambodia | 2.8 /100 | #230 | Tragic $57,580 |
| Immigrants | Nonimmigrants | 2.4 /100 | #231 | Tragic $57,426 |
| Immigrants | Venezuela | 2.3 /100 | #232 | Tragic $57,371 |
| Immigrants | Western Africa | 1.7 /100 | #233 | Tragic $57,119 |
| Immigrants | Burma/Myanmar | 1.7 /100 | #234 | Tragic $57,114 |
| Spanish Americans | 1.6 /100 | #235 | Tragic $57,021 |
| Immigrants | Uruguay | 1.5 /100 | #236 | Tragic $56,975 |
| Immigrants | Panama | 1.5 /100 | #237 | Tragic $56,944 |
| Fijians | 1.2 /100 | #238 | Tragic $56,768 |
| Immigrants | Laos | 1.2 /100 | #239 | Tragic $56,722 |
| Sub-Saharan Africans | 1.0 /100 | #240 | Tragic $56,615 |
| Immigrants | Guyana | 0.9 /100 | #241 | Tragic $56,495 |