Nonimmigrants vs Immigrants from Burma/Myanmar Householder Income Over 65 years
COMPARE
Nonimmigrants
Immigrants from Burma/Myanmar
Householder Income Over 65 years
Householder Income Over 65 years Comparison
Nonimmigrants
Immigrants from Burma/Myanmar
$57,426
HOUSEHOLDER INCOME OVER 65 YEARS
2.4/ 100
METRIC RATING
231st/ 347
METRIC RANK
$57,114
HOUSEHOLDER INCOME OVER 65 YEARS
1.7/ 100
METRIC RATING
234th/ 347
METRIC RANK
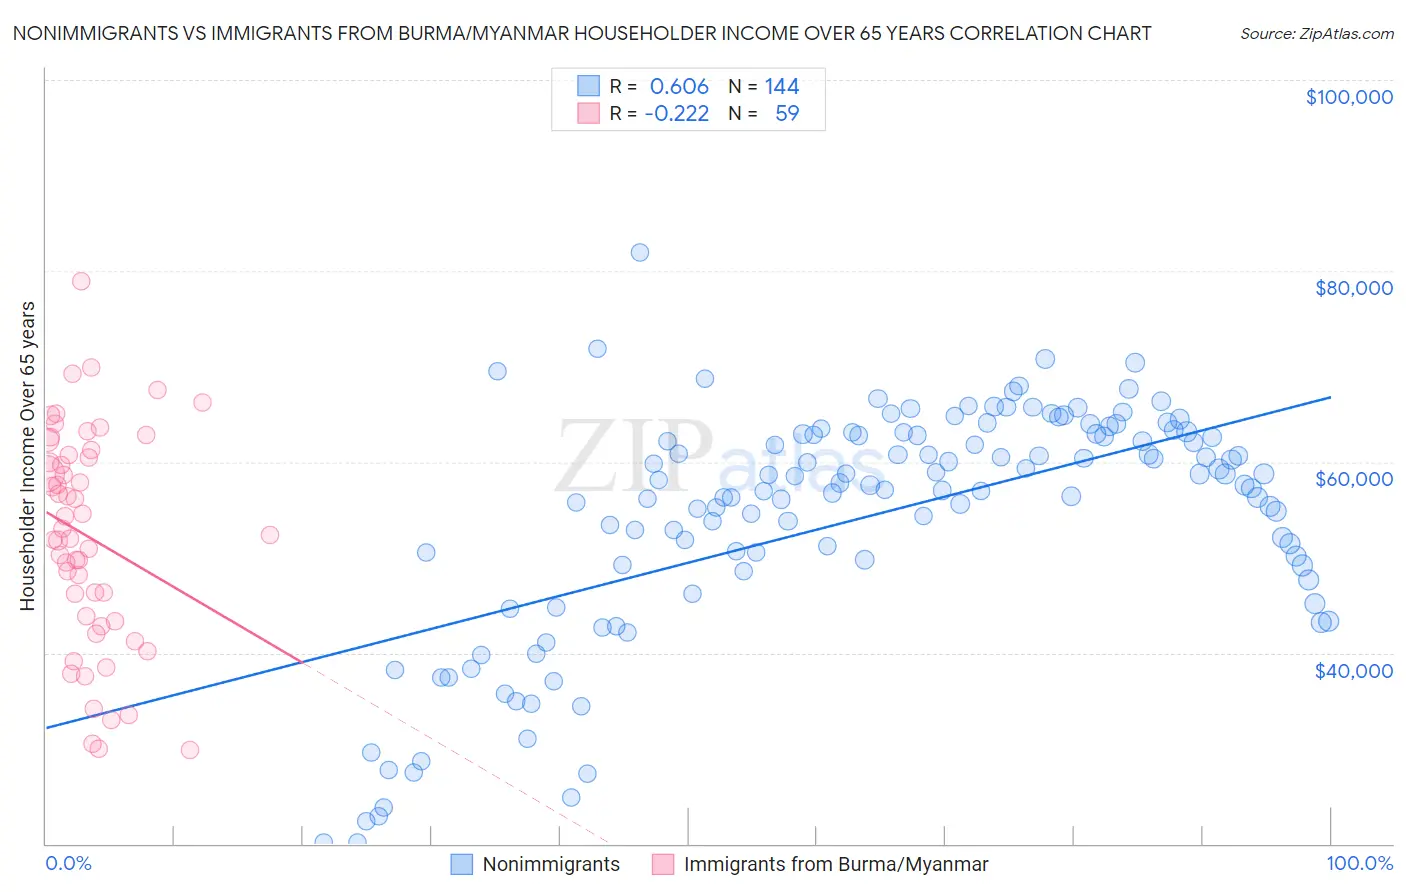
Nonimmigrants vs Immigrants from Burma/Myanmar Householder Income Over 65 years Correlation Chart
The statistical analysis conducted on geographies consisting of 577,532,180 people shows a significant positive correlation between the proportion of Nonimmigrants and household income with householder over the age of 65 in the United States with a correlation coefficient (R) of 0.606 and weighted average of $57,426. Similarly, the statistical analysis conducted on geographies consisting of 172,033,501 people shows a weak negative correlation between the proportion of Immigrants from Burma/Myanmar and household income with householder over the age of 65 in the United States with a correlation coefficient (R) of -0.222 and weighted average of $57,114, a difference of 0.55%.
Householder Income Over 65 years Correlation Summary
| Measurement | Nonimmigrants | Immigrants from Burma/Myanmar |
| Minimum | $20,075 | $29,861 |
| Maximum | $81,974 | $78,969 |
| Range | $61,899 | $49,108 |
| Mean | $54,158 | $52,112 |
| Median | $57,563 | $52,321 |
| Interquartile 25% (IQ1) | $49,141 | $43,364 |
| Interquartile 75% (IQ3) | $62,877 | $60,699 |
| Interquartile Range (IQR) | $13,736 | $17,335 |
| Standard Deviation (Sample) | $12,340 | $11,315 |
| Standard Deviation (Population) | $12,297 | $11,219 |
Demographics Similar to Nonimmigrants and Immigrants from Burma/Myanmar by Householder Income Over 65 years
In terms of householder income over 65 years, the demographic groups most similar to Nonimmigrants are Immigrants from Venezuela ($57,371, a difference of 0.090%), Immigrants from Cambodia ($57,580, a difference of 0.27%), Immigrants from Colombia ($57,658, a difference of 0.41%), Immigrants from Western Africa ($57,119, a difference of 0.54%), and Immigrants from Albania ($57,828, a difference of 0.70%). Similarly, the demographic groups most similar to Immigrants from Burma/Myanmar are Immigrants from Western Africa ($57,119, a difference of 0.010%), Spanish American ($57,021, a difference of 0.16%), Immigrants from Uruguay ($56,975, a difference of 0.24%), Immigrants from Panama ($56,944, a difference of 0.30%), and Immigrants from Venezuela ($57,371, a difference of 0.45%).
| Demographics | Rating | Rank | Householder Income Over 65 years |
| Delaware | 5.3 /100 | #222 | Tragic $58,214 |
| Tsimshian | 5.2 /100 | #223 | Tragic $58,202 |
| Bermudans | 5.1 /100 | #224 | Tragic $58,171 |
| Venezuelans | 4.4 /100 | #225 | Tragic $58,026 |
| French Canadians | 4.2 /100 | #226 | Tragic $57,975 |
| Japanese | 3.9 /100 | #227 | Tragic $57,919 |
| Immigrants | Albania | 3.6 /100 | #228 | Tragic $57,828 |
| Immigrants | Colombia | 3.0 /100 | #229 | Tragic $57,658 |
| Immigrants | Cambodia | 2.8 /100 | #230 | Tragic $57,580 |
| Immigrants | Nonimmigrants | 2.4 /100 | #231 | Tragic $57,426 |
| Immigrants | Venezuela | 2.3 /100 | #232 | Tragic $57,371 |
| Immigrants | Western Africa | 1.7 /100 | #233 | Tragic $57,119 |
| Immigrants | Burma/Myanmar | 1.7 /100 | #234 | Tragic $57,114 |
| Spanish Americans | 1.6 /100 | #235 | Tragic $57,021 |
| Immigrants | Uruguay | 1.5 /100 | #236 | Tragic $56,975 |
| Immigrants | Panama | 1.5 /100 | #237 | Tragic $56,944 |
| Fijians | 1.2 /100 | #238 | Tragic $56,768 |
| Immigrants | Laos | 1.2 /100 | #239 | Tragic $56,722 |
| Sub-Saharan Africans | 1.0 /100 | #240 | Tragic $56,615 |
| Immigrants | Guyana | 0.9 /100 | #241 | Tragic $56,495 |
| Yaqui | 0.8 /100 | #242 | Tragic $56,417 |