Osage vs Yup'ik Householder Income Ages 25 - 44 years
COMPARE
Osage
Yup'ik
Householder Income Ages 25 - 44 years
Householder Income Ages 25 - 44 years Comparison
Osage
Yup'ik
$84,461
HOUSEHOLDER INCOME AGES 25 - 44 YEARS
0.4/ 100
METRIC RATING
264th/ 347
METRIC RANK
$73,688
HOUSEHOLDER INCOME AGES 25 - 44 YEARS
0.0/ 100
METRIC RATING
336th/ 347
METRIC RANK
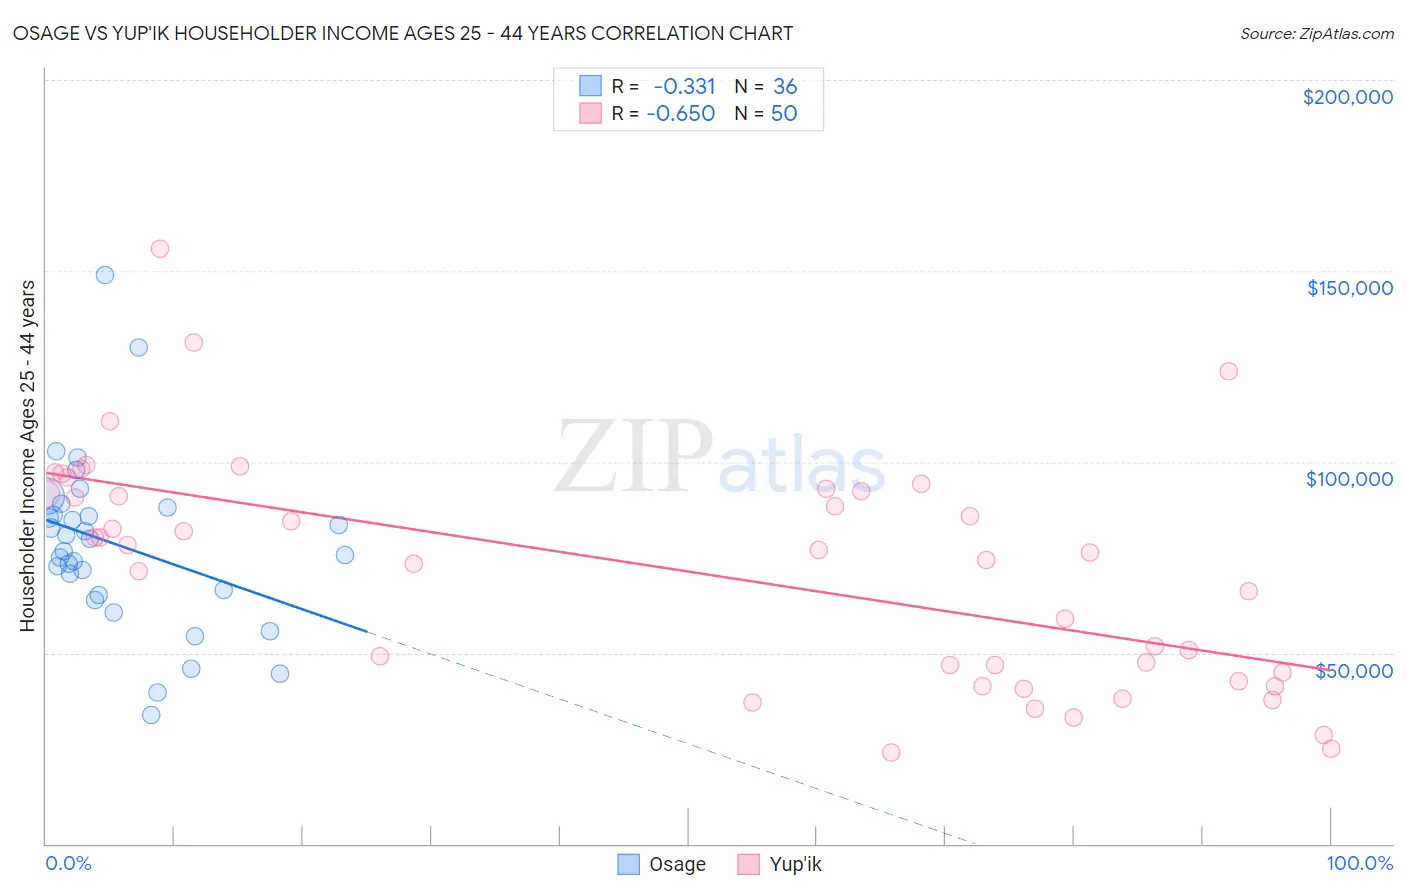
Osage vs Yup'ik Householder Income Ages 25 - 44 years Correlation Chart
The statistical analysis conducted on geographies consisting of 91,715,382 people shows a mild negative correlation between the proportion of Osage and household income with householder between the ages 25 and 44 in the United States with a correlation coefficient (R) of -0.331 and weighted average of $84,461. Similarly, the statistical analysis conducted on geographies consisting of 39,924,420 people shows a significant negative correlation between the proportion of Yup'ik and household income with householder between the ages 25 and 44 in the United States with a correlation coefficient (R) of -0.650 and weighted average of $73,688, a difference of 14.6%.
Householder Income Ages 25 - 44 years Correlation Summary
| Measurement | Osage | Yup'ik |
| Minimum | $33,750 | $23,750 |
| Maximum | $148,966 | $155,658 |
| Range | $115,216 | $131,908 |
| Mean | $78,092 | $71,598 |
| Median | $78,270 | $76,666 |
| Interquartile 25% (IQ1) | $65,799 | $44,951 |
| Interquartile 75% (IQ3) | $87,100 | $92,344 |
| Interquartile Range (IQR) | $21,301 | $47,393 |
| Standard Deviation (Sample) | $22,591 | $29,611 |
| Standard Deviation (Population) | $22,275 | $29,313 |
Similar Demographics by Householder Income Ages 25 - 44 years
Demographics Similar to Osage by Householder Income Ages 25 - 44 years
In terms of householder income ages 25 - 44 years, the demographic groups most similar to Osage are Sudanese ($84,401, a difference of 0.070%), Belizean ($84,534, a difference of 0.090%), Cree ($84,574, a difference of 0.13%), Inupiat ($84,619, a difference of 0.19%), and Immigrants from Cabo Verde ($84,304, a difference of 0.19%).
| Demographics | Rating | Rank | Householder Income Ages 25 - 44 years |
| Mexican American Indians | 0.5 /100 | #257 | Tragic $85,066 |
| Immigrants | Nicaragua | 0.5 /100 | #258 | Tragic $84,914 |
| Immigrants | Senegal | 0.5 /100 | #259 | Tragic $84,848 |
| Americans | 0.4 /100 | #260 | Tragic $84,791 |
| Inupiat | 0.4 /100 | #261 | Tragic $84,619 |
| Cree | 0.4 /100 | #262 | Tragic $84,574 |
| Belizeans | 0.4 /100 | #263 | Tragic $84,534 |
| Osage | 0.4 /100 | #264 | Tragic $84,461 |
| Sudanese | 0.4 /100 | #265 | Tragic $84,401 |
| Immigrants | Cabo Verde | 0.3 /100 | #266 | Tragic $84,304 |
| Hmong | 0.3 /100 | #267 | Tragic $84,258 |
| Sub-Saharan Africans | 0.3 /100 | #268 | Tragic $84,235 |
| Spanish American Indians | 0.3 /100 | #269 | Tragic $84,085 |
| Jamaicans | 0.3 /100 | #270 | Tragic $83,933 |
| Somalis | 0.2 /100 | #271 | Tragic $83,752 |
Demographics Similar to Yup'ik by Householder Income Ages 25 - 44 years
In terms of householder income ages 25 - 44 years, the demographic groups most similar to Yup'ik are Black/African American ($73,370, a difference of 0.43%), Immigrants from Yemen ($73,043, a difference of 0.88%), Yuman ($72,956, a difference of 1.0%), Kiowa ($74,776, a difference of 1.5%), and Creek ($74,847, a difference of 1.6%).
| Demographics | Rating | Rank | Householder Income Ages 25 - 44 years |
| Seminole | 0.0 /100 | #329 | Tragic $76,584 |
| Yakama | 0.0 /100 | #330 | Tragic $76,226 |
| Natives/Alaskans | 0.0 /100 | #331 | Tragic $75,647 |
| Bahamians | 0.0 /100 | #332 | Tragic $75,395 |
| Hopi | 0.0 /100 | #333 | Tragic $75,002 |
| Creek | 0.0 /100 | #334 | Tragic $74,847 |
| Kiowa | 0.0 /100 | #335 | Tragic $74,776 |
| Yup'ik | 0.0 /100 | #336 | Tragic $73,688 |
| Blacks/African Americans | 0.0 /100 | #337 | Tragic $73,370 |
| Immigrants | Yemen | 0.0 /100 | #338 | Tragic $73,043 |
| Yuman | 0.0 /100 | #339 | Tragic $72,956 |
| Immigrants | Congo | 0.0 /100 | #340 | Tragic $72,178 |
| Arapaho | 0.0 /100 | #341 | Tragic $71,697 |
| Crow | 0.0 /100 | #342 | Tragic $71,337 |
| Tohono O'odham | 0.0 /100 | #343 | Tragic $69,068 |