Osage vs Immigrants from South America Householder Income Ages 25 - 44 years
COMPARE
Osage
Immigrants from South America
Householder Income Ages 25 - 44 years
Householder Income Ages 25 - 44 years Comparison
Osage
Immigrants from South America
$84,461
HOUSEHOLDER INCOME AGES 25 - 44 YEARS
0.4/ 100
METRIC RATING
264th/ 347
METRIC RANK
$94,042
HOUSEHOLDER INCOME AGES 25 - 44 YEARS
42.8/ 100
METRIC RATING
178th/ 347
METRIC RANK
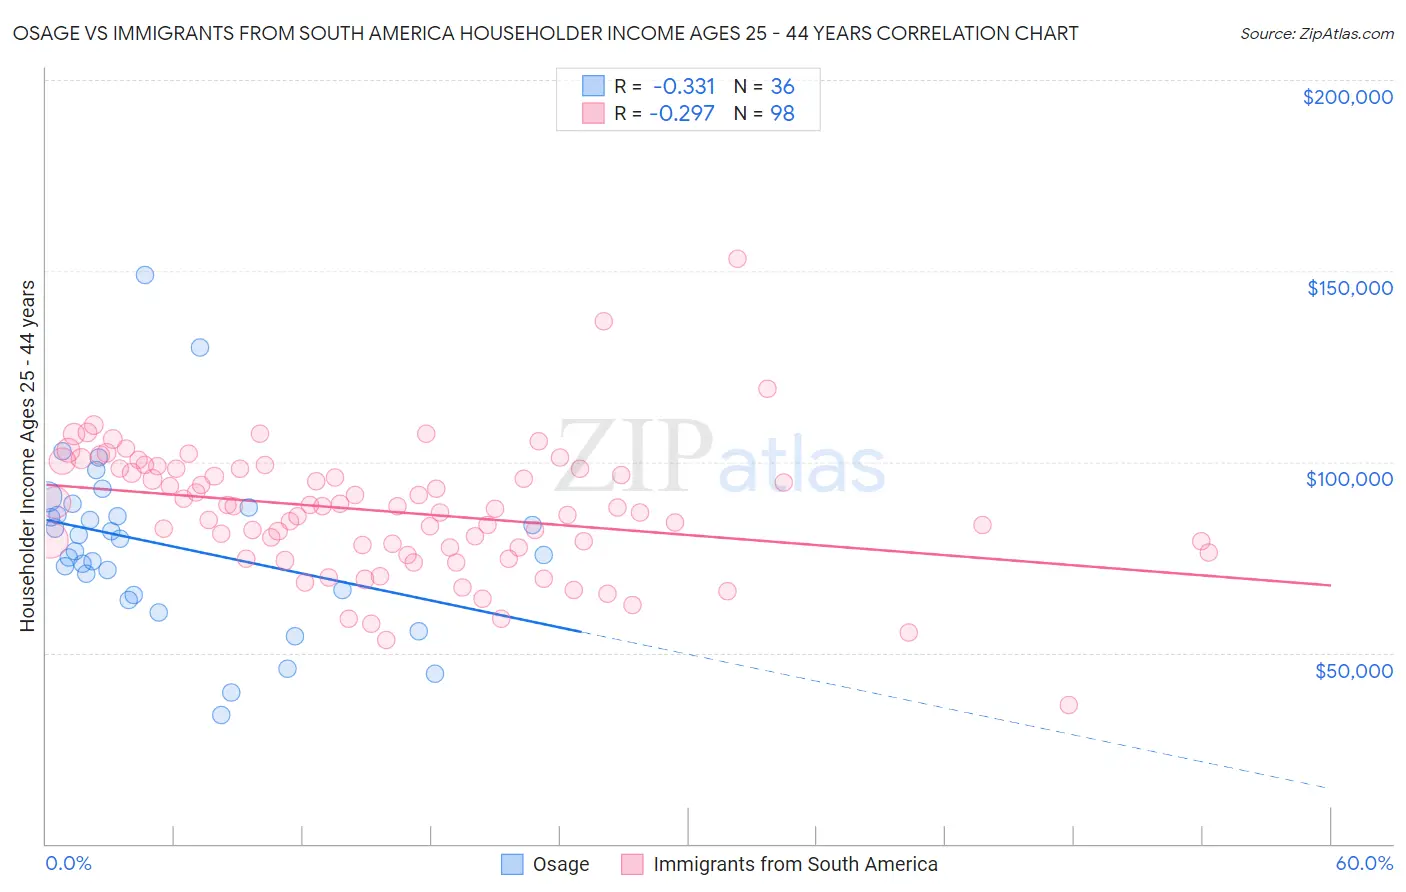
Osage vs Immigrants from South America Householder Income Ages 25 - 44 years Correlation Chart
The statistical analysis conducted on geographies consisting of 91,715,382 people shows a mild negative correlation between the proportion of Osage and household income with householder between the ages 25 and 44 in the United States with a correlation coefficient (R) of -0.331 and weighted average of $84,461. Similarly, the statistical analysis conducted on geographies consisting of 484,511,014 people shows a weak negative correlation between the proportion of Immigrants from South America and household income with householder between the ages 25 and 44 in the United States with a correlation coefficient (R) of -0.297 and weighted average of $94,042, a difference of 11.3%.
Householder Income Ages 25 - 44 years Correlation Summary
| Measurement | Osage | Immigrants from South America |
| Minimum | $33,750 | $36,176 |
| Maximum | $148,966 | $153,313 |
| Range | $115,216 | $117,137 |
| Mean | $78,092 | $86,995 |
| Median | $78,270 | $87,907 |
| Interquartile 25% (IQ1) | $65,799 | $77,429 |
| Interquartile 75% (IQ3) | $87,100 | $98,212 |
| Interquartile Range (IQR) | $21,301 | $20,783 |
| Standard Deviation (Sample) | $22,591 | $16,981 |
| Standard Deviation (Population) | $22,275 | $16,895 |
Similar Demographics by Householder Income Ages 25 - 44 years
Demographics Similar to Osage by Householder Income Ages 25 - 44 years
In terms of householder income ages 25 - 44 years, the demographic groups most similar to Osage are Sudanese ($84,401, a difference of 0.070%), Belizean ($84,534, a difference of 0.090%), Cree ($84,574, a difference of 0.13%), Inupiat ($84,619, a difference of 0.19%), and Immigrants from Cabo Verde ($84,304, a difference of 0.19%).
| Demographics | Rating | Rank | Householder Income Ages 25 - 44 years |
| Mexican American Indians | 0.5 /100 | #257 | Tragic $85,066 |
| Immigrants | Nicaragua | 0.5 /100 | #258 | Tragic $84,914 |
| Immigrants | Senegal | 0.5 /100 | #259 | Tragic $84,848 |
| Americans | 0.4 /100 | #260 | Tragic $84,791 |
| Inupiat | 0.4 /100 | #261 | Tragic $84,619 |
| Cree | 0.4 /100 | #262 | Tragic $84,574 |
| Belizeans | 0.4 /100 | #263 | Tragic $84,534 |
| Osage | 0.4 /100 | #264 | Tragic $84,461 |
| Sudanese | 0.4 /100 | #265 | Tragic $84,401 |
| Immigrants | Cabo Verde | 0.3 /100 | #266 | Tragic $84,304 |
| Hmong | 0.3 /100 | #267 | Tragic $84,258 |
| Sub-Saharan Africans | 0.3 /100 | #268 | Tragic $84,235 |
| Spanish American Indians | 0.3 /100 | #269 | Tragic $84,085 |
| Jamaicans | 0.3 /100 | #270 | Tragic $83,933 |
| Somalis | 0.2 /100 | #271 | Tragic $83,752 |
Demographics Similar to Immigrants from South America by Householder Income Ages 25 - 44 years
In terms of householder income ages 25 - 44 years, the demographic groups most similar to Immigrants from South America are Belgian ($94,262, a difference of 0.23%), French Canadian ($93,694, a difference of 0.37%), Immigrants ($94,423, a difference of 0.40%), French ($93,665, a difference of 0.40%), and English ($94,429, a difference of 0.41%).
| Demographics | Rating | Rank | Householder Income Ages 25 - 44 years |
| Immigrants | Armenia | 54.2 /100 | #171 | Average $94,867 |
| Scottish | 50.8 /100 | #172 | Average $94,622 |
| Finns | 50.6 /100 | #173 | Average $94,610 |
| Colombians | 50.0 /100 | #174 | Average $94,565 |
| English | 48.1 /100 | #175 | Average $94,429 |
| Immigrants | Immigrants | 48.0 /100 | #176 | Average $94,423 |
| Belgians | 45.8 /100 | #177 | Average $94,262 |
| Immigrants | South America | 42.8 /100 | #178 | Average $94,042 |
| French Canadians | 38.2 /100 | #179 | Fair $93,694 |
| French | 37.8 /100 | #180 | Fair $93,665 |
| Puget Sound Salish | 37.7 /100 | #181 | Fair $93,661 |
| Uruguayans | 37.3 /100 | #182 | Fair $93,631 |
| Guamanians/Chamorros | 36.5 /100 | #183 | Fair $93,569 |
| Germans | 36.0 /100 | #184 | Fair $93,531 |
| Immigrants | Eritrea | 35.2 /100 | #185 | Fair $93,466 |