Okinawan vs Yaqui Per Capita Income
COMPARE
Okinawan
Yaqui
Per Capita Income
Per Capita Income Comparison
Okinawans
Yaqui
$55,817
PER CAPITA INCOME
100.0/ 100
METRIC RATING
10th/ 347
METRIC RANK
$36,112
PER CAPITA INCOME
0.0/ 100
METRIC RATING
315th/ 347
METRIC RANK
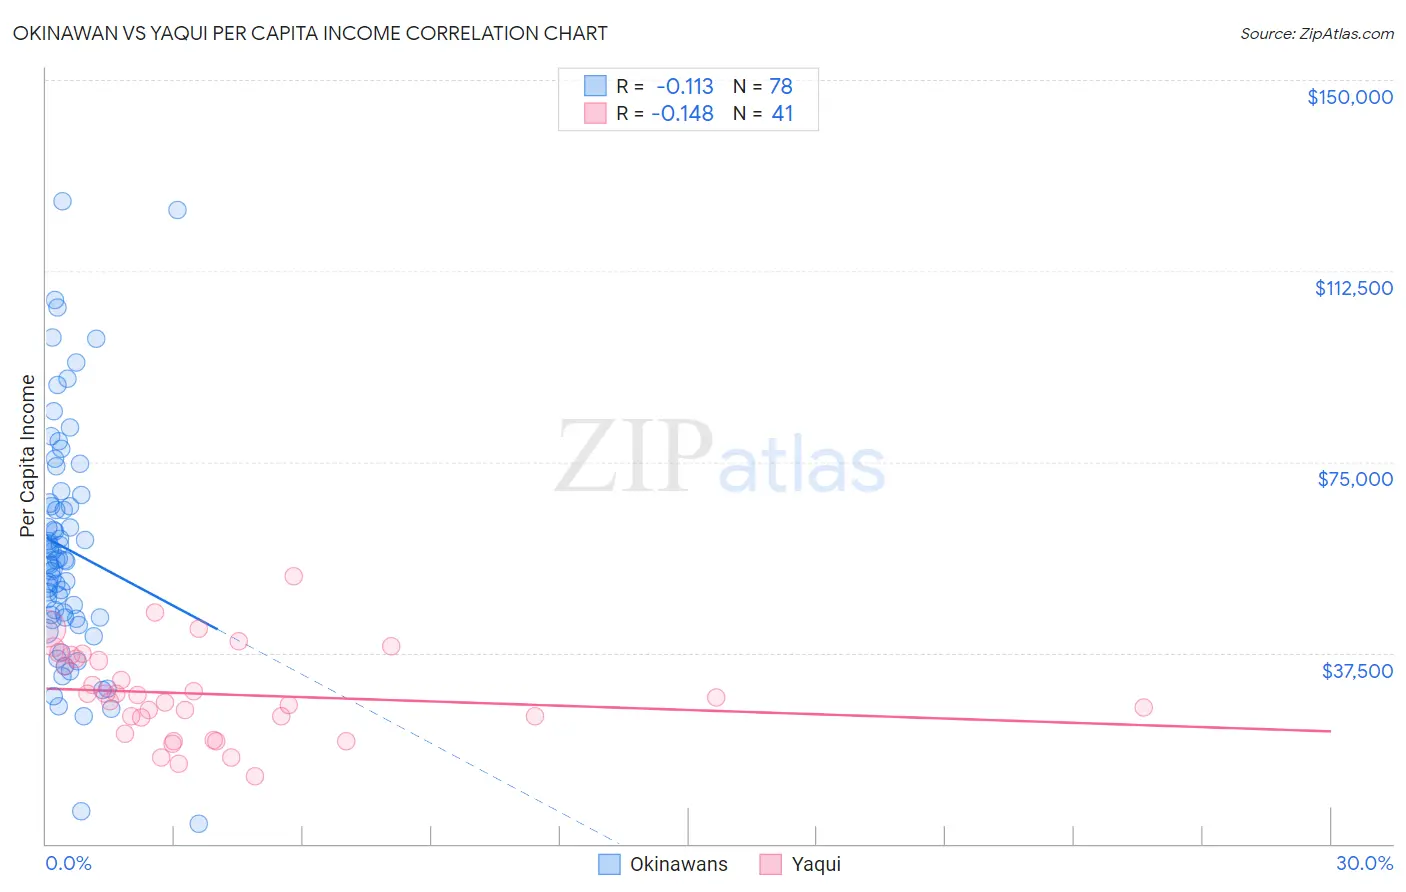
Okinawan vs Yaqui Per Capita Income Correlation Chart
The statistical analysis conducted on geographies consisting of 73,745,153 people shows a poor negative correlation between the proportion of Okinawans and per capita income in the United States with a correlation coefficient (R) of -0.113 and weighted average of $55,817. Similarly, the statistical analysis conducted on geographies consisting of 107,738,640 people shows a poor negative correlation between the proportion of Yaqui and per capita income in the United States with a correlation coefficient (R) of -0.148 and weighted average of $36,112, a difference of 54.6%.
Per Capita Income Correlation Summary
| Measurement | Okinawan | Yaqui |
| Minimum | $4,017 | $13,349 |
| Maximum | $126,204 | $52,546 |
| Range | $122,187 | $39,197 |
| Mean | $57,948 | $29,404 |
| Median | $55,509 | $28,671 |
| Interquartile 25% (IQ1) | $44,396 | $23,138 |
| Interquartile 75% (IQ3) | $66,910 | $36,720 |
| Interquartile Range (IQR) | $22,513 | $13,582 |
| Standard Deviation (Sample) | $23,213 | $8,788 |
| Standard Deviation (Population) | $23,064 | $8,680 |
Similar Demographics by Per Capita Income
Demographics Similar to Okinawans by Per Capita Income
In terms of per capita income, the demographic groups most similar to Okinawans are Eastern European ($55,780, a difference of 0.070%), Immigrants from Sweden ($55,582, a difference of 0.42%), Immigrants from India ($55,268, a difference of 0.99%), Immigrants from Belgium ($55,082, a difference of 1.3%), and Immigrants from Ireland ($56,584, a difference of 1.4%).
| Demographics | Rating | Rank | Per Capita Income |
| Immigrants | Singapore | 100.0 /100 | #3 | Exceptional $58,353 |
| Immigrants | Australia | 100.0 /100 | #4 | Exceptional $57,953 |
| Immigrants | Iran | 100.0 /100 | #5 | Exceptional $57,759 |
| Immigrants | Taiwan | 100.0 /100 | #6 | Exceptional $57,742 |
| Immigrants | Israel | 100.0 /100 | #7 | Exceptional $57,384 |
| Immigrants | Hong Kong | 100.0 /100 | #8 | Exceptional $56,709 |
| Immigrants | Ireland | 100.0 /100 | #9 | Exceptional $56,584 |
| Okinawans | 100.0 /100 | #10 | Exceptional $55,817 |
| Eastern Europeans | 100.0 /100 | #11 | Exceptional $55,780 |
| Immigrants | Sweden | 100.0 /100 | #12 | Exceptional $55,582 |
| Immigrants | India | 100.0 /100 | #13 | Exceptional $55,268 |
| Immigrants | Belgium | 100.0 /100 | #14 | Exceptional $55,082 |
| Cypriots | 100.0 /100 | #15 | Exceptional $54,899 |
| Immigrants | Switzerland | 100.0 /100 | #16 | Exceptional $54,866 |
| Immigrants | France | 100.0 /100 | #17 | Exceptional $54,557 |
Demographics Similar to Yaqui by Per Capita Income
In terms of per capita income, the demographic groups most similar to Yaqui are Seminole ($36,180, a difference of 0.19%), Choctaw ($35,999, a difference of 0.31%), Dutch West Indian ($35,922, a difference of 0.53%), Bangladeshi ($35,897, a difference of 0.60%), and Bahamian ($36,427, a difference of 0.87%).
| Demographics | Rating | Rank | Per Capita Income |
| Fijians | 0.0 /100 | #308 | Tragic $36,690 |
| Immigrants | Honduras | 0.0 /100 | #309 | Tragic $36,665 |
| Ute | 0.0 /100 | #310 | Tragic $36,651 |
| Chippewa | 0.0 /100 | #311 | Tragic $36,631 |
| Chickasaw | 0.0 /100 | #312 | Tragic $36,475 |
| Bahamians | 0.0 /100 | #313 | Tragic $36,427 |
| Seminole | 0.0 /100 | #314 | Tragic $36,180 |
| Yaqui | 0.0 /100 | #315 | Tragic $36,112 |
| Choctaw | 0.0 /100 | #316 | Tragic $35,999 |
| Dutch West Indians | 0.0 /100 | #317 | Tragic $35,922 |
| Bangladeshis | 0.0 /100 | #318 | Tragic $35,897 |
| Immigrants | Congo | 0.0 /100 | #319 | Tragic $35,720 |
| Hispanics or Latinos | 0.0 /100 | #320 | Tragic $35,688 |
| Blacks/African Americans | 0.0 /100 | #321 | Tragic $35,564 |
| Creek | 0.0 /100 | #322 | Tragic $35,546 |