Okinawan vs Immigrants from Uzbekistan Male Poverty
COMPARE
Okinawan
Immigrants from Uzbekistan
Male Poverty
Male Poverty Comparison
Okinawans
Immigrants from Uzbekistan
10.7%
MALE POVERTY
87.6/ 100
METRIC RATING
118th/ 347
METRIC RANK
12.2%
MALE POVERTY
2.6/ 100
METRIC RATING
215th/ 347
METRIC RANK
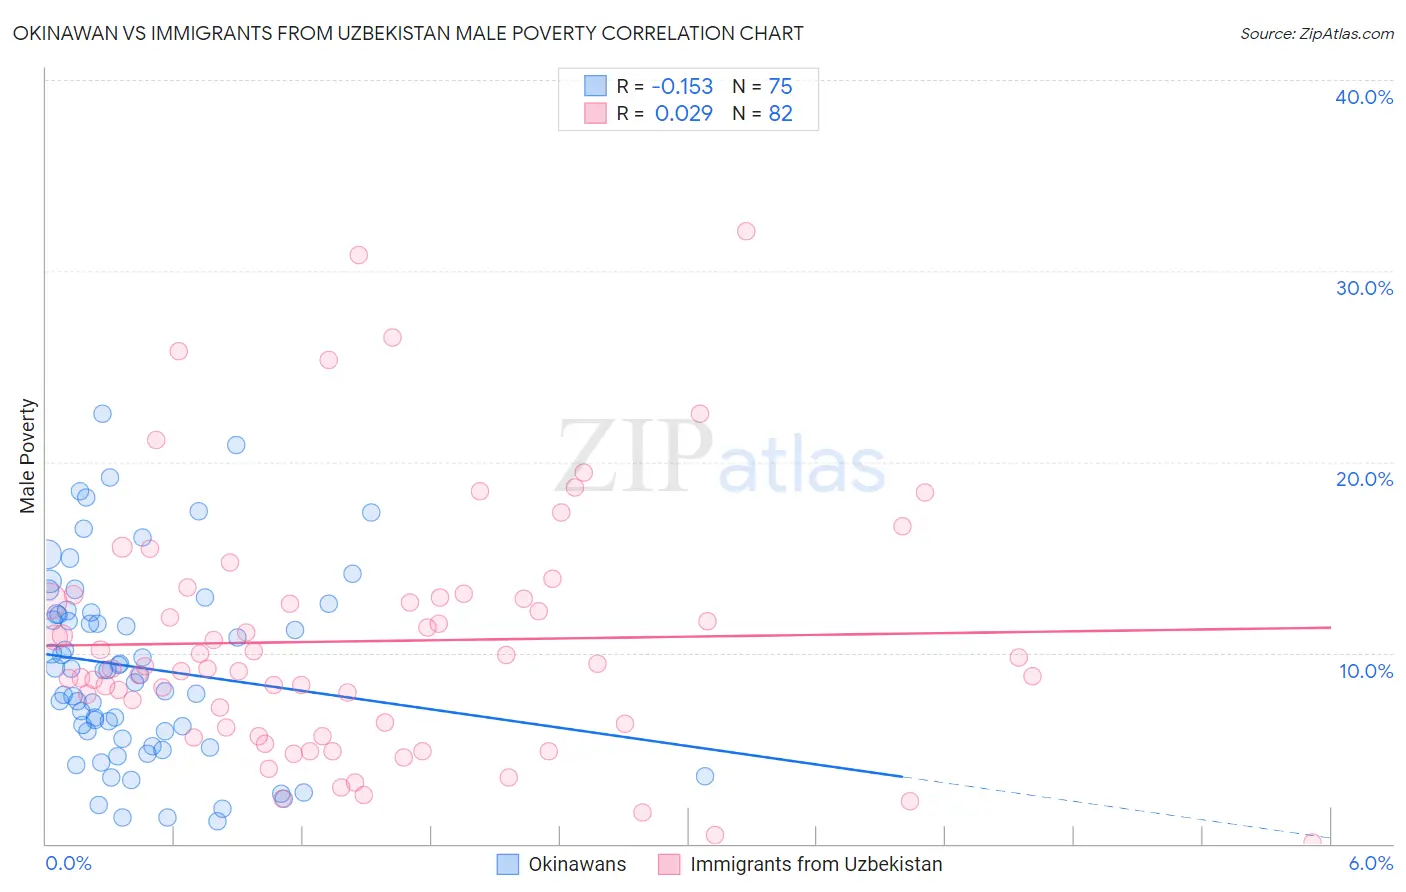
Okinawan vs Immigrants from Uzbekistan Male Poverty Correlation Chart
The statistical analysis conducted on geographies consisting of 73,717,243 people shows a poor negative correlation between the proportion of Okinawans and poverty level among males in the United States with a correlation coefficient (R) of -0.153 and weighted average of 10.7%. Similarly, the statistical analysis conducted on geographies consisting of 118,712,457 people shows no correlation between the proportion of Immigrants from Uzbekistan and poverty level among males in the United States with a correlation coefficient (R) of 0.029 and weighted average of 12.2%, a difference of 14.4%.
Male Poverty Correlation Summary
| Measurement | Okinawan | Immigrants from Uzbekistan |
| Minimum | 1.2% | 0.066% |
| Maximum | 22.5% | 32.1% |
| Range | 21.3% | 32.0% |
| Mean | 9.2% | 10.6% |
| Median | 9.1% | 9.2% |
| Interquartile 25% (IQ1) | 5.5% | 6.1% |
| Interquartile 75% (IQ3) | 12.1% | 12.9% |
| Interquartile Range (IQR) | 6.6% | 6.9% |
| Standard Deviation (Sample) | 5.0% | 6.5% |
| Standard Deviation (Population) | 4.9% | 6.5% |
Similar Demographics by Male Poverty
Demographics Similar to Okinawans by Male Poverty
In terms of male poverty, the demographic groups most similar to Okinawans are Immigrants from Hungary (10.7%, a difference of 0.010%), Immigrants from South Eastern Asia (10.6%, a difference of 0.11%), Immigrants from China (10.7%, a difference of 0.11%), Sri Lankan (10.6%, a difference of 0.12%), and Peruvian (10.7%, a difference of 0.12%).
| Demographics | Rating | Rank | Male Poverty |
| Immigrants | Argentina | 89.8 /100 | #111 | Excellent 10.6% |
| Immigrants | Turkey | 89.5 /100 | #112 | Excellent 10.6% |
| Palestinians | 89.1 /100 | #113 | Excellent 10.6% |
| Immigrants | Brazil | 89.0 /100 | #114 | Excellent 10.6% |
| Immigrants | Russia | 88.6 /100 | #115 | Excellent 10.6% |
| Sri Lankans | 88.1 /100 | #116 | Excellent 10.6% |
| Immigrants | South Eastern Asia | 88.1 /100 | #117 | Excellent 10.6% |
| Okinawans | 87.6 /100 | #118 | Excellent 10.7% |
| Immigrants | Hungary | 87.6 /100 | #119 | Excellent 10.7% |
| Immigrants | China | 87.1 /100 | #120 | Excellent 10.7% |
| Peruvians | 87.1 /100 | #121 | Excellent 10.7% |
| Native Hawaiians | 87.0 /100 | #122 | Excellent 10.7% |
| South Africans | 86.8 /100 | #123 | Excellent 10.7% |
| French | 86.7 /100 | #124 | Excellent 10.7% |
| Immigrants | Norway | 86.0 /100 | #125 | Excellent 10.7% |
Demographics Similar to Immigrants from Uzbekistan by Male Poverty
In terms of male poverty, the demographic groups most similar to Immigrants from Uzbekistan are Immigrants from Cambodia (12.2%, a difference of 0.080%), Immigrants from Thailand (12.2%, a difference of 0.090%), German Russian (12.2%, a difference of 0.11%), Japanese (12.2%, a difference of 0.12%), and Bermudan (12.2%, a difference of 0.18%).
| Demographics | Rating | Rank | Male Poverty |
| Immigrants | Immigrants | 4.5 /100 | #208 | Tragic 12.0% |
| Immigrants | Azores | 4.3 /100 | #209 | Tragic 12.0% |
| Moroccans | 4.2 /100 | #210 | Tragic 12.0% |
| Immigrants | Panama | 4.0 /100 | #211 | Tragic 12.1% |
| Americans | 3.2 /100 | #212 | Tragic 12.1% |
| Immigrants | Nonimmigrants | 3.1 /100 | #213 | Tragic 12.1% |
| Japanese | 2.7 /100 | #214 | Tragic 12.2% |
| Immigrants | Uzbekistan | 2.6 /100 | #215 | Tragic 12.2% |
| Immigrants | Cambodia | 2.5 /100 | #216 | Tragic 12.2% |
| Immigrants | Thailand | 2.5 /100 | #217 | Tragic 12.2% |
| German Russians | 2.5 /100 | #218 | Tragic 12.2% |
| Bermudans | 2.4 /100 | #219 | Tragic 12.2% |
| Immigrants | Eritrea | 2.4 /100 | #220 | Tragic 12.2% |
| Ugandans | 2.2 /100 | #221 | Tragic 12.2% |
| Immigrants | Africa | 2.1 /100 | #222 | Tragic 12.2% |