Northern European vs Salvadoran Median Male Earnings
COMPARE
Northern European
Salvadoran
Median Male Earnings
Median Male Earnings Comparison
Northern Europeans
Salvadorans
$58,588
MEDIAN MALE EARNINGS
98.2/ 100
METRIC RATING
97th/ 347
METRIC RANK
$48,646
MEDIAN MALE EARNINGS
0.3/ 100
METRIC RATING
272nd/ 347
METRIC RANK
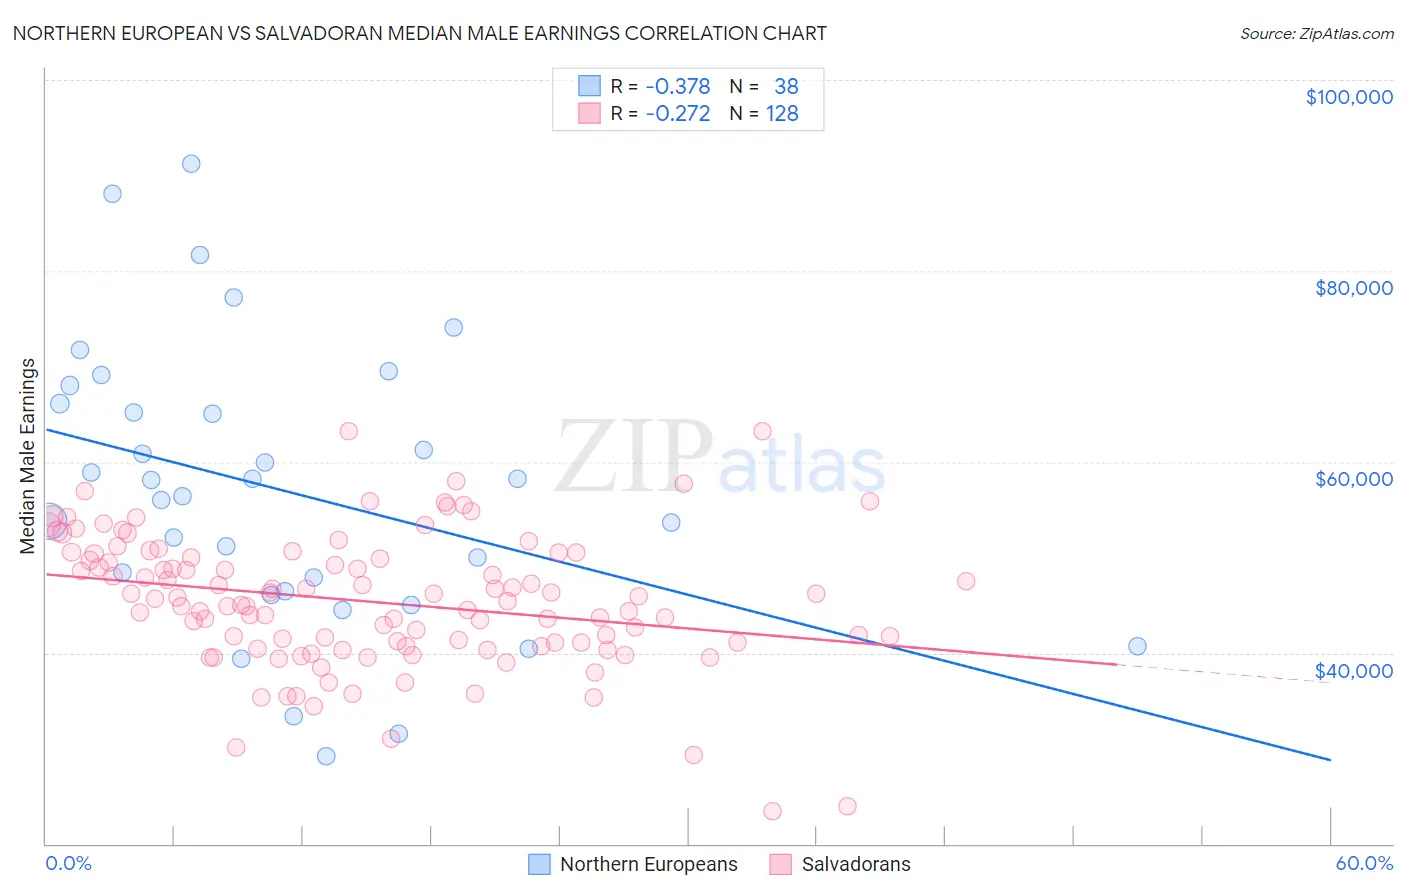
Northern European vs Salvadoran Median Male Earnings Correlation Chart
The statistical analysis conducted on geographies consisting of 405,884,643 people shows a mild negative correlation between the proportion of Northern Europeans and median male earnings in the United States with a correlation coefficient (R) of -0.378 and weighted average of $58,588. Similarly, the statistical analysis conducted on geographies consisting of 398,918,079 people shows a weak negative correlation between the proportion of Salvadorans and median male earnings in the United States with a correlation coefficient (R) of -0.272 and weighted average of $48,646, a difference of 20.4%.
Median Male Earnings Correlation Summary
| Measurement | Northern European | Salvadoran |
| Minimum | $29,177 | $23,439 |
| Maximum | $91,267 | $63,214 |
| Range | $62,090 | $39,775 |
| Mean | $57,049 | $45,362 |
| Median | $57,215 | $45,515 |
| Interquartile 25% (IQ1) | $46,389 | $40,883 |
| Interquartile 75% (IQ3) | $66,077 | $50,182 |
| Interquartile Range (IQR) | $19,687 | $9,299 |
| Standard Deviation (Sample) | $14,710 | $7,004 |
| Standard Deviation (Population) | $14,515 | $6,977 |
Similar Demographics by Median Male Earnings
Demographics Similar to Northern Europeans by Median Male Earnings
In terms of median male earnings, the demographic groups most similar to Northern Europeans are Jordanian ($58,500, a difference of 0.15%), Albanian ($58,680, a difference of 0.16%), Immigrants from Poland ($58,452, a difference of 0.23%), Assyrian/Chaldean/Syriac ($58,437, a difference of 0.26%), and Immigrants from Lebanon ($58,835, a difference of 0.42%).
| Demographics | Rating | Rank | Median Male Earnings |
| Austrians | 99.2 /100 | #90 | Exceptional $59,359 |
| Laotians | 99.2 /100 | #91 | Exceptional $59,351 |
| Immigrants | Kazakhstan | 99.1 /100 | #92 | Exceptional $59,278 |
| Immigrants | Southern Europe | 99.0 /100 | #93 | Exceptional $59,217 |
| Immigrants | North Macedonia | 99.0 /100 | #94 | Exceptional $59,189 |
| Immigrants | Lebanon | 98.6 /100 | #95 | Exceptional $58,835 |
| Albanians | 98.4 /100 | #96 | Exceptional $58,680 |
| Northern Europeans | 98.2 /100 | #97 | Exceptional $58,588 |
| Jordanians | 98.1 /100 | #98 | Exceptional $58,500 |
| Immigrants | Poland | 98.0 /100 | #99 | Exceptional $58,452 |
| Assyrians/Chaldeans/Syriacs | 97.9 /100 | #100 | Exceptional $58,437 |
| Immigrants | Brazil | 97.7 /100 | #101 | Exceptional $58,324 |
| Syrians | 97.4 /100 | #102 | Exceptional $58,187 |
| Poles | 97.3 /100 | #103 | Exceptional $58,139 |
| Armenians | 97.3 /100 | #104 | Exceptional $58,134 |
Demographics Similar to Salvadorans by Median Male Earnings
In terms of median male earnings, the demographic groups most similar to Salvadorans are Jamaican ($48,632, a difference of 0.030%), Cherokee ($48,669, a difference of 0.050%), Potawatomi ($48,768, a difference of 0.25%), Colville ($48,516, a difference of 0.27%), and Tsimshian ($48,836, a difference of 0.39%).
| Demographics | Rating | Rank | Median Male Earnings |
| Immigrants | Laos | 0.6 /100 | #265 | Tragic $49,190 |
| Somalis | 0.5 /100 | #266 | Tragic $49,025 |
| Spanish Americans | 0.5 /100 | #267 | Tragic $49,008 |
| Ute | 0.4 /100 | #268 | Tragic $48,899 |
| Tsimshian | 0.4 /100 | #269 | Tragic $48,836 |
| Potawatomi | 0.4 /100 | #270 | Tragic $48,768 |
| Cherokee | 0.3 /100 | #271 | Tragic $48,669 |
| Salvadorans | 0.3 /100 | #272 | Tragic $48,646 |
| Jamaicans | 0.3 /100 | #273 | Tragic $48,632 |
| Colville | 0.3 /100 | #274 | Tragic $48,516 |
| Immigrants | Somalia | 0.3 /100 | #275 | Tragic $48,439 |
| Blackfeet | 0.3 /100 | #276 | Tragic $48,402 |
| Belizeans | 0.2 /100 | #277 | Tragic $48,358 |
| Immigrants | Liberia | 0.2 /100 | #278 | Tragic $48,317 |
| Hmong | 0.2 /100 | #279 | Tragic $48,254 |