Nonimmigrants vs Chilean Householder Income Ages 45 - 64 years
COMPARE
Nonimmigrants
Chilean
Householder Income Ages 45 - 64 years
Householder Income Ages 45 - 64 years Comparison
Nonimmigrants
Chileans
$94,448
HOUSEHOLDER INCOME AGES 45 - 64 YEARS
5.0/ 100
METRIC RATING
223rd/ 347
METRIC RANK
$106,611
HOUSEHOLDER INCOME AGES 45 - 64 YEARS
95.9/ 100
METRIC RATING
109th/ 347
METRIC RANK
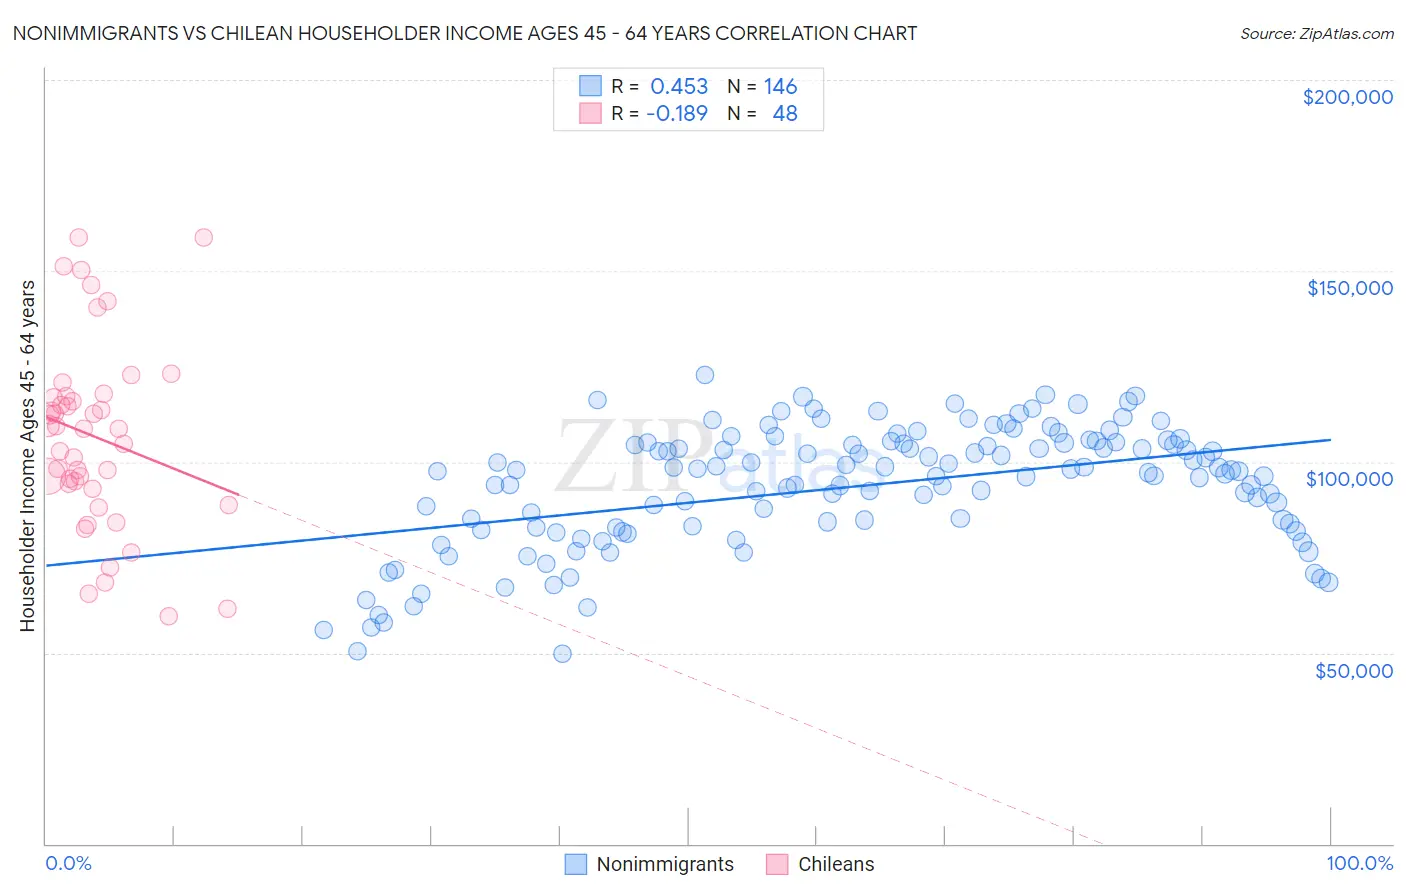
Nonimmigrants vs Chilean Householder Income Ages 45 - 64 years Correlation Chart
The statistical analysis conducted on geographies consisting of 578,858,945 people shows a moderate positive correlation between the proportion of Nonimmigrants and household income with householder between the ages 45 and 64 in the United States with a correlation coefficient (R) of 0.453 and weighted average of $94,448. Similarly, the statistical analysis conducted on geographies consisting of 256,404,590 people shows a poor negative correlation between the proportion of Chileans and household income with householder between the ages 45 and 64 in the United States with a correlation coefficient (R) of -0.189 and weighted average of $106,611, a difference of 12.9%.
Householder Income Ages 45 - 64 years Correlation Summary
| Measurement | Nonimmigrants | Chilean |
| Minimum | $49,742 | $59,712 |
| Maximum | $122,626 | $158,750 |
| Range | $72,884 | $99,038 |
| Mean | $93,614 | $106,575 |
| Median | $97,642 | $108,628 |
| Interquartile 25% (IQ1) | $82,744 | $93,623 |
| Interquartile 75% (IQ3) | $104,952 | $117,063 |
| Interquartile Range (IQR) | $22,209 | $23,441 |
| Standard Deviation (Sample) | $15,816 | $24,255 |
| Standard Deviation (Population) | $15,762 | $24,001 |
Similar Demographics by Householder Income Ages 45 - 64 years
Demographics Similar to Nonimmigrants by Householder Income Ages 45 - 64 years
In terms of householder income ages 45 - 64 years, the demographic groups most similar to Nonimmigrants are Malaysian ($94,517, a difference of 0.070%), Immigrants from Bosnia and Herzegovina ($94,288, a difference of 0.17%), Bermudan ($94,197, a difference of 0.27%), Immigrants from the Azores ($94,138, a difference of 0.33%), and Immigrants from Nigeria ($94,804, a difference of 0.38%).
| Demographics | Rating | Rank | Householder Income Ages 45 - 64 years |
| Immigrants | Venezuela | 7.6 /100 | #216 | Tragic $95,342 |
| Immigrants | Ghana | 6.4 /100 | #217 | Tragic $94,982 |
| Delaware | 6.2 /100 | #218 | Tragic $94,914 |
| Immigrants | Armenia | 6.1 /100 | #219 | Tragic $94,863 |
| Salvadorans | 6.0 /100 | #220 | Tragic $94,842 |
| Immigrants | Nigeria | 5.9 /100 | #221 | Tragic $94,804 |
| Malaysians | 5.2 /100 | #222 | Tragic $94,517 |
| Immigrants | Nonimmigrants | 5.0 /100 | #223 | Tragic $94,448 |
| Immigrants | Bosnia and Herzegovina | 4.6 /100 | #224 | Tragic $94,288 |
| Bermudans | 4.4 /100 | #225 | Tragic $94,197 |
| Immigrants | Azores | 4.3 /100 | #226 | Tragic $94,138 |
| Alaska Natives | 4.0 /100 | #227 | Tragic $93,991 |
| Immigrants | Panama | 3.7 /100 | #228 | Tragic $93,815 |
| Vietnamese | 3.6 /100 | #229 | Tragic $93,788 |
| Immigrants | Sudan | 3.6 /100 | #230 | Tragic $93,781 |
Demographics Similar to Chileans by Householder Income Ages 45 - 64 years
In terms of householder income ages 45 - 64 years, the demographic groups most similar to Chileans are Immigrants from Brazil ($106,470, a difference of 0.13%), Immigrants from Vietnam ($106,417, a difference of 0.18%), Zimbabwean ($106,849, a difference of 0.22%), Swedish ($106,377, a difference of 0.22%), and European ($106,367, a difference of 0.23%).
| Demographics | Rating | Rank | Householder Income Ages 45 - 64 years |
| Immigrants | Moldova | 97.1 /100 | #102 | Exceptional $107,357 |
| Syrians | 96.9 /100 | #103 | Exceptional $107,207 |
| Immigrants | Ukraine | 96.7 /100 | #104 | Exceptional $107,079 |
| Macedonians | 96.7 /100 | #105 | Exceptional $107,074 |
| Armenians | 96.6 /100 | #106 | Exceptional $107,002 |
| Immigrants | Fiji | 96.5 /100 | #107 | Exceptional $106,952 |
| Zimbabweans | 96.3 /100 | #108 | Exceptional $106,849 |
| Chileans | 95.9 /100 | #109 | Exceptional $106,611 |
| Immigrants | Brazil | 95.6 /100 | #110 | Exceptional $106,470 |
| Immigrants | Vietnam | 95.5 /100 | #111 | Exceptional $106,417 |
| Swedes | 95.4 /100 | #112 | Exceptional $106,377 |
| Europeans | 95.4 /100 | #113 | Exceptional $106,367 |
| Immigrants | Poland | 95.3 /100 | #114 | Exceptional $106,319 |
| Immigrants | Kuwait | 95.2 /100 | #115 | Exceptional $106,285 |
| British | 95.2 /100 | #116 | Exceptional $106,264 |