Nonimmigrants vs Immigrants from Bahamas Householder Income Ages 25 - 44 years
COMPARE
Nonimmigrants
Immigrants from Bahamas
Householder Income Ages 25 - 44 years
Householder Income Ages 25 - 44 years Comparison
Nonimmigrants
Immigrants from Bahamas
$88,301
HOUSEHOLDER INCOME AGES 25 - 44 YEARS
3.0/ 100
METRIC RATING
232nd/ 347
METRIC RANK
$76,910
HOUSEHOLDER INCOME AGES 25 - 44 YEARS
0.0/ 100
METRIC RATING
327th/ 347
METRIC RANK
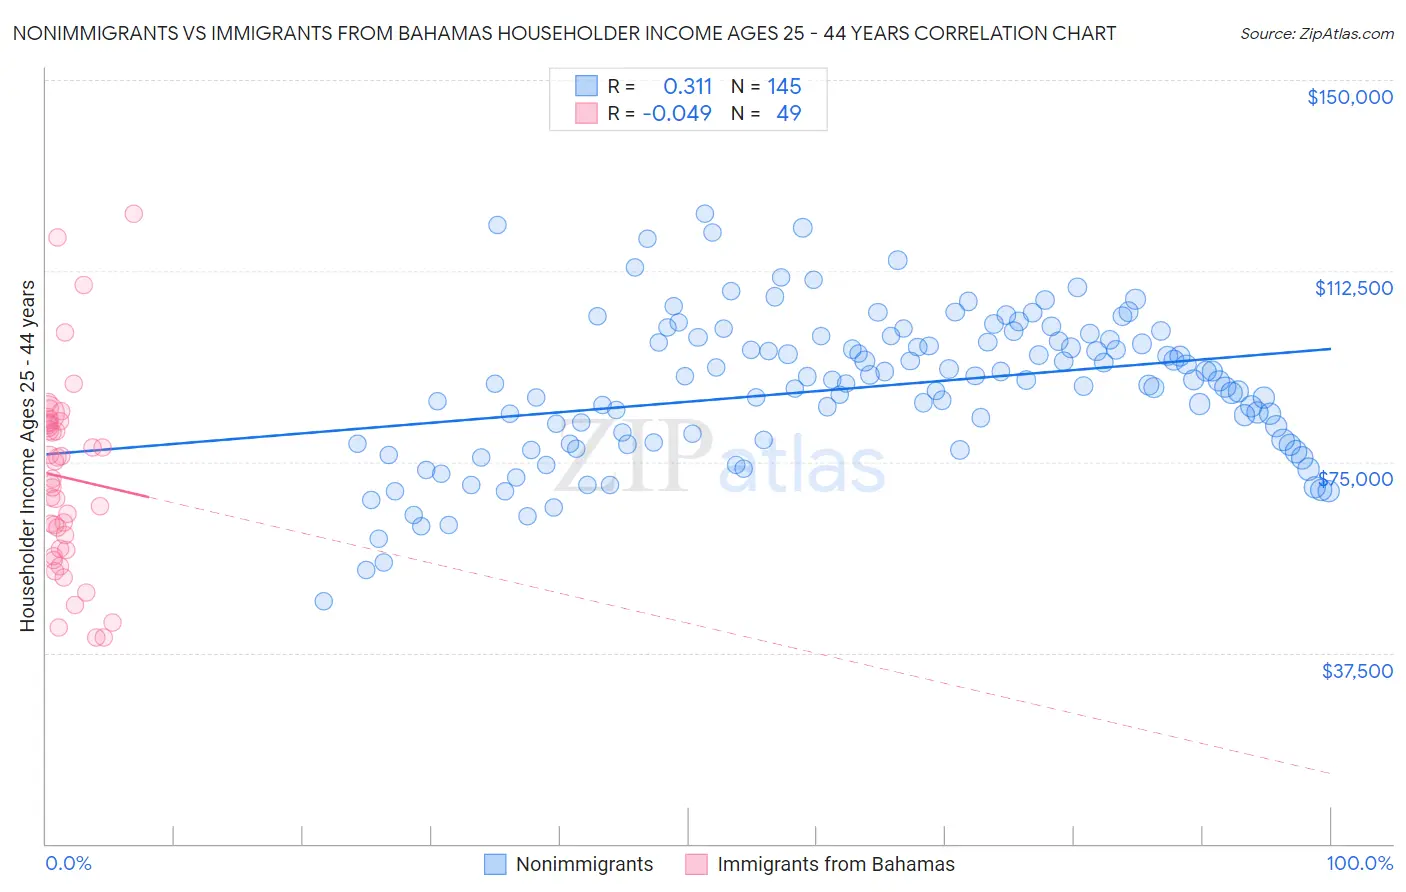
Nonimmigrants vs Immigrants from Bahamas Householder Income Ages 25 - 44 years Correlation Chart
The statistical analysis conducted on geographies consisting of 576,019,560 people shows a mild positive correlation between the proportion of Nonimmigrants and household income with householder between the ages 25 and 44 in the United States with a correlation coefficient (R) of 0.311 and weighted average of $88,301. Similarly, the statistical analysis conducted on geographies consisting of 104,540,789 people shows no correlation between the proportion of Immigrants from Bahamas and household income with householder between the ages 25 and 44 in the United States with a correlation coefficient (R) of -0.049 and weighted average of $76,910, a difference of 14.8%.
Householder Income Ages 25 - 44 years Correlation Summary
| Measurement | Nonimmigrants | Immigrants from Bahamas |
| Minimum | $47,510 | $40,456 |
| Maximum | $123,721 | $123,699 |
| Range | $76,211 | $83,243 |
| Mean | $89,568 | $71,953 |
| Median | $91,026 | $71,583 |
| Interquartile 25% (IQ1) | $78,698 | $57,810 |
| Interquartile 75% (IQ3) | $99,239 | $82,867 |
| Interquartile Range (IQR) | $20,541 | $25,057 |
| Standard Deviation (Sample) | $14,473 | $18,615 |
| Standard Deviation (Population) | $14,423 | $18,424 |
Similar Demographics by Householder Income Ages 25 - 44 years
Demographics Similar to Nonimmigrants by Householder Income Ages 25 - 44 years
In terms of householder income ages 25 - 44 years, the demographic groups most similar to Nonimmigrants are Immigrants from Grenada ($88,311, a difference of 0.010%), Malaysian ($88,291, a difference of 0.010%), Venezuelan ($88,232, a difference of 0.080%), Bermudan ($88,231, a difference of 0.080%), and Immigrants from Cameroon ($88,214, a difference of 0.10%).
| Demographics | Rating | Rank | Householder Income Ages 25 - 44 years |
| Immigrants | Panama | 5.5 /100 | #225 | Tragic $89,451 |
| Immigrants | Iraq | 5.5 /100 | #226 | Tragic $89,444 |
| Immigrants | St. Vincent and the Grenadines | 4.1 /100 | #227 | Tragic $88,888 |
| Immigrants | Bosnia and Herzegovina | 4.0 /100 | #228 | Tragic $88,819 |
| Immigrants | Barbados | 3.7 /100 | #229 | Tragic $88,687 |
| Alaskan Athabascans | 3.3 /100 | #230 | Tragic $88,446 |
| Immigrants | Grenada | 3.0 /100 | #231 | Tragic $88,311 |
| Immigrants | Nonimmigrants | 3.0 /100 | #232 | Tragic $88,301 |
| Malaysians | 3.0 /100 | #233 | Tragic $88,291 |
| Venezuelans | 2.9 /100 | #234 | Tragic $88,232 |
| Bermudans | 2.9 /100 | #235 | Tragic $88,231 |
| Immigrants | Cameroon | 2.9 /100 | #236 | Tragic $88,214 |
| Salvadorans | 2.8 /100 | #237 | Tragic $88,198 |
| Alaska Natives | 2.6 /100 | #238 | Tragic $88,018 |
| Immigrants | Ghana | 2.2 /100 | #239 | Tragic $87,760 |
Demographics Similar to Immigrants from Bahamas by Householder Income Ages 25 - 44 years
In terms of householder income ages 25 - 44 years, the demographic groups most similar to Immigrants from Bahamas are Houma ($77,044, a difference of 0.17%), Sioux ($77,089, a difference of 0.23%), Immigrants from Cuba ($76,701, a difference of 0.27%), Seminole ($76,584, a difference of 0.42%), and Dutch West Indian ($77,260, a difference of 0.46%).
| Demographics | Rating | Rank | Householder Income Ages 25 - 44 years |
| Choctaw | 0.0 /100 | #320 | Tragic $78,168 |
| Immigrants | Zaire | 0.0 /100 | #321 | Tragic $78,045 |
| Chickasaw | 0.0 /100 | #322 | Tragic $77,929 |
| Immigrants | Honduras | 0.0 /100 | #323 | Tragic $77,328 |
| Dutch West Indians | 0.0 /100 | #324 | Tragic $77,260 |
| Sioux | 0.0 /100 | #325 | Tragic $77,089 |
| Houma | 0.0 /100 | #326 | Tragic $77,044 |
| Immigrants | Bahamas | 0.0 /100 | #327 | Tragic $76,910 |
| Immigrants | Cuba | 0.0 /100 | #328 | Tragic $76,701 |
| Seminole | 0.0 /100 | #329 | Tragic $76,584 |
| Yakama | 0.0 /100 | #330 | Tragic $76,226 |
| Natives/Alaskans | 0.0 /100 | #331 | Tragic $75,647 |
| Bahamians | 0.0 /100 | #332 | Tragic $75,395 |
| Hopi | 0.0 /100 | #333 | Tragic $75,002 |
| Creek | 0.0 /100 | #334 | Tragic $74,847 |