Japanese vs Immigrants from Grenada Householder Income Ages 25 - 44 years
COMPARE
Japanese
Immigrants from Grenada
Householder Income Ages 25 - 44 years
Householder Income Ages 25 - 44 years Comparison
Japanese
Immigrants from Grenada
$91,624
HOUSEHOLDER INCOME AGES 25 - 44 YEARS
16.4/ 100
METRIC RATING
201st/ 347
METRIC RANK
$88,311
HOUSEHOLDER INCOME AGES 25 - 44 YEARS
3.0/ 100
METRIC RATING
231st/ 347
METRIC RANK
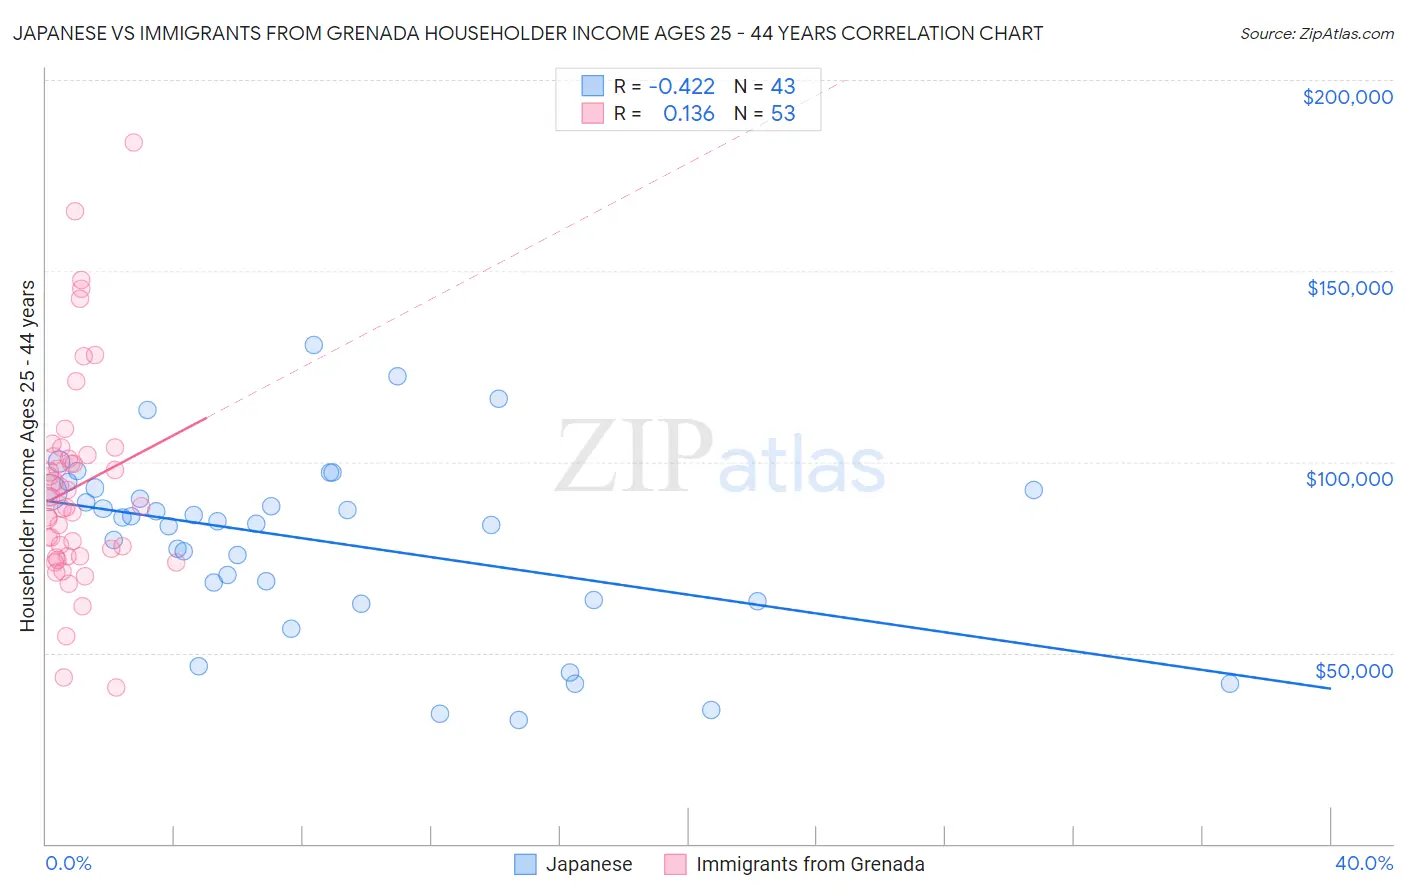
Japanese vs Immigrants from Grenada Householder Income Ages 25 - 44 years Correlation Chart
The statistical analysis conducted on geographies consisting of 248,932,234 people shows a moderate negative correlation between the proportion of Japanese and household income with householder between the ages 25 and 44 in the United States with a correlation coefficient (R) of -0.422 and weighted average of $91,624. Similarly, the statistical analysis conducted on geographies consisting of 67,165,379 people shows a poor positive correlation between the proportion of Immigrants from Grenada and household income with householder between the ages 25 and 44 in the United States with a correlation coefficient (R) of 0.136 and weighted average of $88,311, a difference of 3.7%.
Householder Income Ages 25 - 44 years Correlation Summary
| Measurement | Japanese | Immigrants from Grenada |
| Minimum | $32,434 | $40,942 |
| Maximum | $130,694 | $183,750 |
| Range | $98,260 | $142,808 |
| Mean | $79,326 | $93,291 |
| Median | $84,545 | $88,464 |
| Interquartile 25% (IQ1) | $63,836 | $75,281 |
| Interquartile 75% (IQ3) | $92,776 | $101,579 |
| Interquartile Range (IQR) | $28,940 | $26,298 |
| Standard Deviation (Sample) | $23,298 | $27,452 |
| Standard Deviation (Population) | $23,025 | $27,192 |
Similar Demographics by Householder Income Ages 25 - 44 years
Demographics Similar to Japanese by Householder Income Ages 25 - 44 years
In terms of householder income ages 25 - 44 years, the demographic groups most similar to Japanese are White/Caucasian ($91,668, a difference of 0.050%), Ecuadorian ($91,574, a difference of 0.050%), Kenyan ($91,684, a difference of 0.070%), Immigrants from Cambodia ($91,533, a difference of 0.10%), and Nepalese ($91,498, a difference of 0.14%).
| Demographics | Rating | Rank | Householder Income Ages 25 - 44 years |
| Immigrants | Azores | 22.4 /100 | #194 | Fair $92,322 |
| Celtics | 21.6 /100 | #195 | Fair $92,241 |
| Immigrants | Colombia | 21.3 /100 | #196 | Fair $92,204 |
| Spanish | 21.2 /100 | #197 | Fair $92,200 |
| Vietnamese | 20.2 /100 | #198 | Fair $92,089 |
| Kenyans | 16.8 /100 | #199 | Poor $91,684 |
| Whites/Caucasians | 16.7 /100 | #200 | Poor $91,668 |
| Japanese | 16.4 /100 | #201 | Poor $91,624 |
| Ecuadorians | 16.0 /100 | #202 | Poor $91,574 |
| Immigrants | Cambodia | 15.7 /100 | #203 | Poor $91,533 |
| Nepalese | 15.4 /100 | #204 | Poor $91,498 |
| Immigrants | Eastern Africa | 15.2 /100 | #205 | Poor $91,458 |
| Aleuts | 14.5 /100 | #206 | Poor $91,370 |
| Yugoslavians | 14.5 /100 | #207 | Poor $91,368 |
| Immigrants | Thailand | 14.3 /100 | #208 | Poor $91,337 |
Demographics Similar to Immigrants from Grenada by Householder Income Ages 25 - 44 years
In terms of householder income ages 25 - 44 years, the demographic groups most similar to Immigrants from Grenada are Nonimmigrants ($88,301, a difference of 0.010%), Malaysian ($88,291, a difference of 0.020%), Venezuelan ($88,232, a difference of 0.090%), Bermudan ($88,231, a difference of 0.090%), and Immigrants from Cameroon ($88,214, a difference of 0.11%).
| Demographics | Rating | Rank | Householder Income Ages 25 - 44 years |
| Barbadians | 5.9 /100 | #224 | Tragic $89,565 |
| Immigrants | Panama | 5.5 /100 | #225 | Tragic $89,451 |
| Immigrants | Iraq | 5.5 /100 | #226 | Tragic $89,444 |
| Immigrants | St. Vincent and the Grenadines | 4.1 /100 | #227 | Tragic $88,888 |
| Immigrants | Bosnia and Herzegovina | 4.0 /100 | #228 | Tragic $88,819 |
| Immigrants | Barbados | 3.7 /100 | #229 | Tragic $88,687 |
| Alaskan Athabascans | 3.3 /100 | #230 | Tragic $88,446 |
| Immigrants | Grenada | 3.0 /100 | #231 | Tragic $88,311 |
| Immigrants | Nonimmigrants | 3.0 /100 | #232 | Tragic $88,301 |
| Malaysians | 3.0 /100 | #233 | Tragic $88,291 |
| Venezuelans | 2.9 /100 | #234 | Tragic $88,232 |
| Bermudans | 2.9 /100 | #235 | Tragic $88,231 |
| Immigrants | Cameroon | 2.9 /100 | #236 | Tragic $88,214 |
| Salvadorans | 2.8 /100 | #237 | Tragic $88,198 |
| Alaska Natives | 2.6 /100 | #238 | Tragic $88,018 |