Immigrants from Eastern Africa vs Immigrants from Grenada Householder Income Ages 25 - 44 years
COMPARE
Immigrants from Eastern Africa
Immigrants from Grenada
Householder Income Ages 25 - 44 years
Householder Income Ages 25 - 44 years Comparison
Immigrants from Eastern Africa
Immigrants from Grenada
$91,458
HOUSEHOLDER INCOME AGES 25 - 44 YEARS
15.2/ 100
METRIC RATING
205th/ 347
METRIC RANK
$88,311
HOUSEHOLDER INCOME AGES 25 - 44 YEARS
3.0/ 100
METRIC RATING
231st/ 347
METRIC RANK
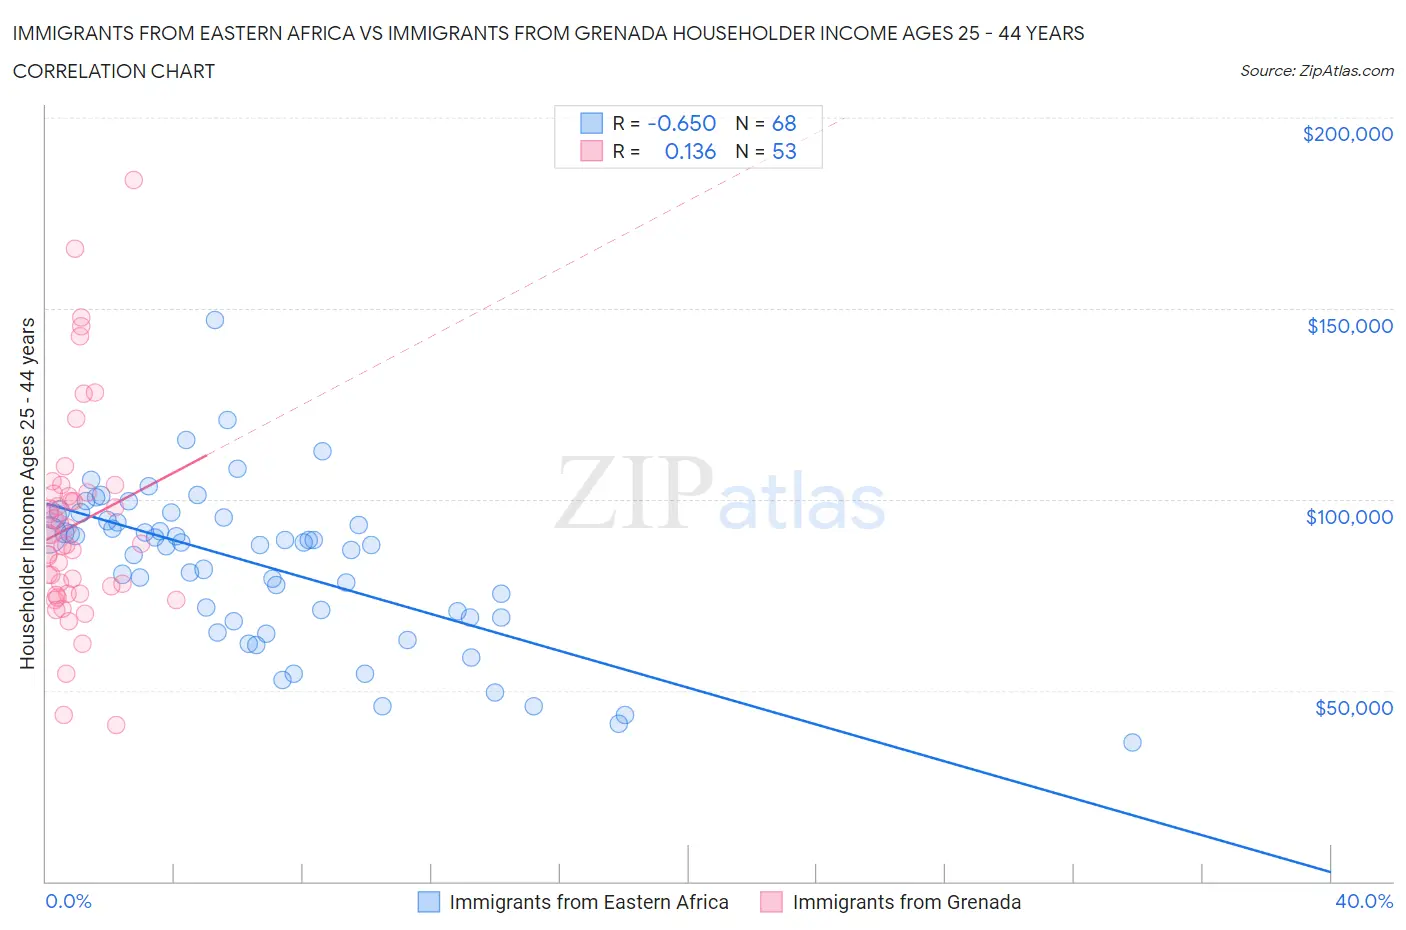
Immigrants from Eastern Africa vs Immigrants from Grenada Householder Income Ages 25 - 44 years Correlation Chart
The statistical analysis conducted on geographies consisting of 354,447,145 people shows a significant negative correlation between the proportion of Immigrants from Eastern Africa and household income with householder between the ages 25 and 44 in the United States with a correlation coefficient (R) of -0.650 and weighted average of $91,458. Similarly, the statistical analysis conducted on geographies consisting of 67,165,379 people shows a poor positive correlation between the proportion of Immigrants from Grenada and household income with householder between the ages 25 and 44 in the United States with a correlation coefficient (R) of 0.136 and weighted average of $88,311, a difference of 3.6%.
Householder Income Ages 25 - 44 years Correlation Summary
| Measurement | Immigrants from Eastern Africa | Immigrants from Grenada |
| Minimum | $36,409 | $40,942 |
| Maximum | $146,936 | $183,750 |
| Range | $110,527 | $142,808 |
| Mean | $82,778 | $93,291 |
| Median | $88,339 | $88,464 |
| Interquartile 25% (IQ1) | $69,093 | $75,281 |
| Interquartile 75% (IQ3) | $94,875 | $101,579 |
| Interquartile Range (IQR) | $25,782 | $26,298 |
| Standard Deviation (Sample) | $20,521 | $27,452 |
| Standard Deviation (Population) | $20,370 | $27,192 |
Similar Demographics by Householder Income Ages 25 - 44 years
Demographics Similar to Immigrants from Eastern Africa by Householder Income Ages 25 - 44 years
In terms of householder income ages 25 - 44 years, the demographic groups most similar to Immigrants from Eastern Africa are Nepalese ($91,498, a difference of 0.040%), Immigrants from Cambodia ($91,533, a difference of 0.080%), Aleut ($91,370, a difference of 0.10%), Yugoslavian ($91,368, a difference of 0.10%), and Ecuadorian ($91,574, a difference of 0.13%).
| Demographics | Rating | Rank | Householder Income Ages 25 - 44 years |
| Vietnamese | 20.2 /100 | #198 | Fair $92,089 |
| Kenyans | 16.8 /100 | #199 | Poor $91,684 |
| Whites/Caucasians | 16.7 /100 | #200 | Poor $91,668 |
| Japanese | 16.4 /100 | #201 | Poor $91,624 |
| Ecuadorians | 16.0 /100 | #202 | Poor $91,574 |
| Immigrants | Cambodia | 15.7 /100 | #203 | Poor $91,533 |
| Nepalese | 15.4 /100 | #204 | Poor $91,498 |
| Immigrants | Eastern Africa | 15.2 /100 | #205 | Poor $91,458 |
| Aleuts | 14.5 /100 | #206 | Poor $91,370 |
| Yugoslavians | 14.5 /100 | #207 | Poor $91,368 |
| Immigrants | Thailand | 14.3 /100 | #208 | Poor $91,337 |
| Immigrants | Uruguay | 13.2 /100 | #209 | Poor $91,171 |
| Immigrants | Kenya | 10.9 /100 | #210 | Poor $90,767 |
| Iraqis | 10.8 /100 | #211 | Poor $90,764 |
| Hawaiians | 10.6 /100 | #212 | Poor $90,722 |
Demographics Similar to Immigrants from Grenada by Householder Income Ages 25 - 44 years
In terms of householder income ages 25 - 44 years, the demographic groups most similar to Immigrants from Grenada are Nonimmigrants ($88,301, a difference of 0.010%), Malaysian ($88,291, a difference of 0.020%), Venezuelan ($88,232, a difference of 0.090%), Bermudan ($88,231, a difference of 0.090%), and Immigrants from Cameroon ($88,214, a difference of 0.11%).
| Demographics | Rating | Rank | Householder Income Ages 25 - 44 years |
| Barbadians | 5.9 /100 | #224 | Tragic $89,565 |
| Immigrants | Panama | 5.5 /100 | #225 | Tragic $89,451 |
| Immigrants | Iraq | 5.5 /100 | #226 | Tragic $89,444 |
| Immigrants | St. Vincent and the Grenadines | 4.1 /100 | #227 | Tragic $88,888 |
| Immigrants | Bosnia and Herzegovina | 4.0 /100 | #228 | Tragic $88,819 |
| Immigrants | Barbados | 3.7 /100 | #229 | Tragic $88,687 |
| Alaskan Athabascans | 3.3 /100 | #230 | Tragic $88,446 |
| Immigrants | Grenada | 3.0 /100 | #231 | Tragic $88,311 |
| Immigrants | Nonimmigrants | 3.0 /100 | #232 | Tragic $88,301 |
| Malaysians | 3.0 /100 | #233 | Tragic $88,291 |
| Venezuelans | 2.9 /100 | #234 | Tragic $88,232 |
| Bermudans | 2.9 /100 | #235 | Tragic $88,231 |
| Immigrants | Cameroon | 2.9 /100 | #236 | Tragic $88,214 |
| Salvadorans | 2.8 /100 | #237 | Tragic $88,198 |
| Alaska Natives | 2.6 /100 | #238 | Tragic $88,018 |