Nigerian vs Central American Per Capita Income
COMPARE
Nigerian
Central American
Per Capita Income
Per Capita Income Comparison
Nigerians
Central Americans
$41,026
PER CAPITA INCOME
4.9/ 100
METRIC RATING
229th/ 347
METRIC RANK
$38,560
PER CAPITA INCOME
0.3/ 100
METRIC RATING
271st/ 347
METRIC RANK
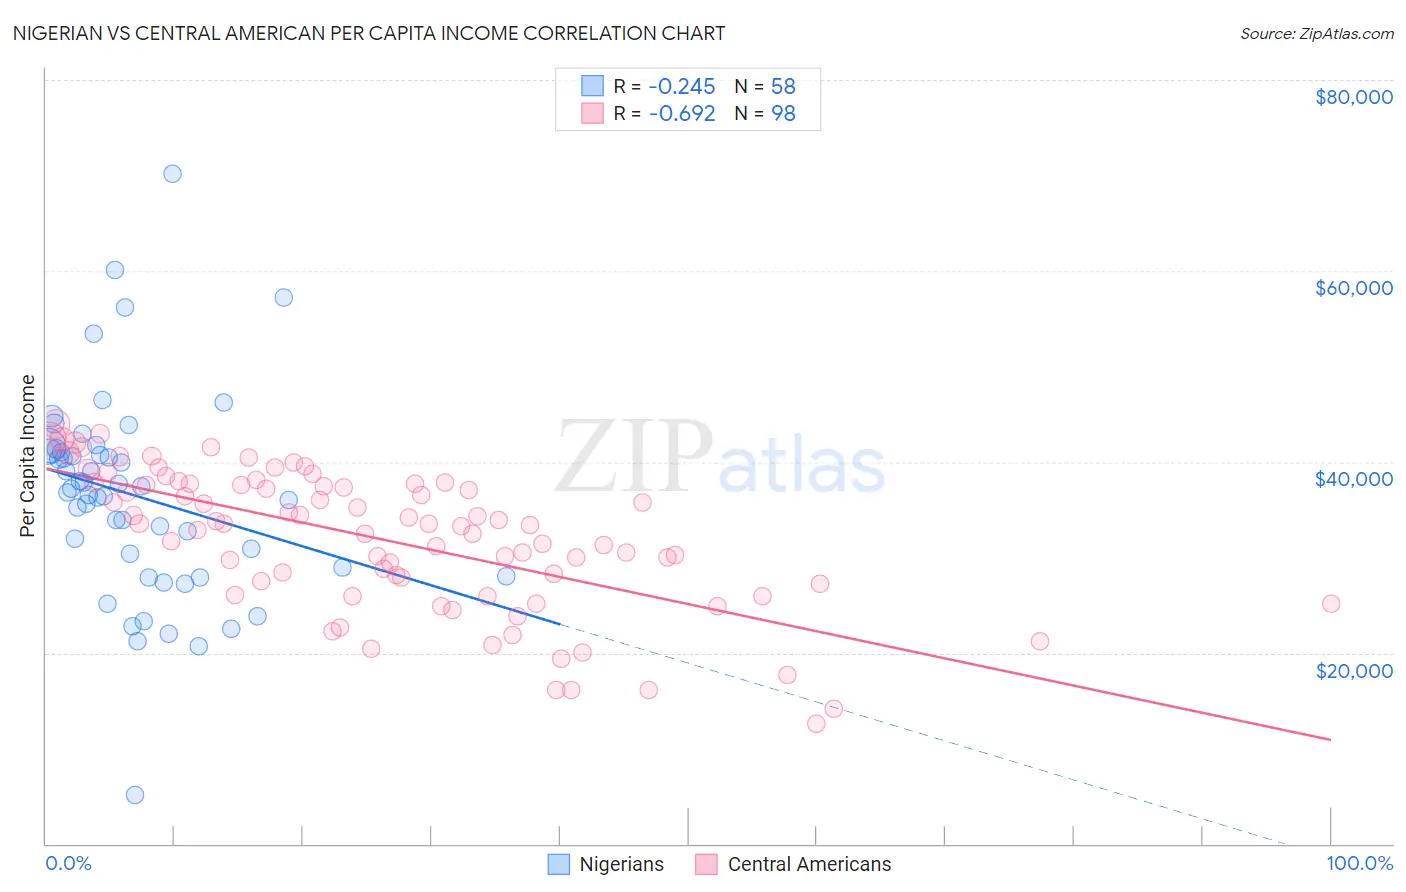
Nigerian vs Central American Per Capita Income Correlation Chart
The statistical analysis conducted on geographies consisting of 332,796,588 people shows a weak negative correlation between the proportion of Nigerians and per capita income in the United States with a correlation coefficient (R) of -0.245 and weighted average of $41,026. Similarly, the statistical analysis conducted on geographies consisting of 504,669,146 people shows a significant negative correlation between the proportion of Central Americans and per capita income in the United States with a correlation coefficient (R) of -0.692 and weighted average of $38,560, a difference of 6.4%.
Per Capita Income Correlation Summary
| Measurement | Nigerian | Central American |
| Minimum | $5,085 | $12,606 |
| Maximum | $70,186 | $43,950 |
| Range | $65,101 | $31,344 |
| Mean | $36,468 | $31,868 |
| Median | $37,024 | $33,444 |
| Interquartile 25% (IQ1) | $28,928 | $27,188 |
| Interquartile 75% (IQ3) | $41,176 | $37,671 |
| Interquartile Range (IQR) | $12,248 | $10,483 |
| Standard Deviation (Sample) | $10,721 | $7,379 |
| Standard Deviation (Population) | $10,628 | $7,341 |
Similar Demographics by Per Capita Income
Demographics Similar to Nigerians by Per Capita Income
In terms of per capita income, the demographic groups most similar to Nigerians are Native Hawaiian ($41,017, a difference of 0.020%), Senegalese ($41,000, a difference of 0.060%), Guyanese ($40,949, a difference of 0.19%), Immigrants from Grenada ($41,123, a difference of 0.24%), and Immigrants from Ghana ($41,131, a difference of 0.26%).
| Demographics | Rating | Rank | Per Capita Income |
| Immigrants | Iraq | 7.1 /100 | #222 | Tragic $41,365 |
| Immigrants | Cameroon | 6.8 /100 | #223 | Tragic $41,334 |
| Immigrants | St. Vincent and the Grenadines | 6.4 /100 | #224 | Tragic $41,270 |
| West Indians | 6.0 /100 | #225 | Tragic $41,217 |
| Immigrants | Ecuador | 5.9 /100 | #226 | Tragic $41,195 |
| Immigrants | Ghana | 5.5 /100 | #227 | Tragic $41,131 |
| Immigrants | Grenada | 5.5 /100 | #228 | Tragic $41,123 |
| Nigerians | 4.9 /100 | #229 | Tragic $41,026 |
| Native Hawaiians | 4.9 /100 | #230 | Tragic $41,017 |
| Senegalese | 4.8 /100 | #231 | Tragic $41,000 |
| Guyanese | 4.5 /100 | #232 | Tragic $40,949 |
| Delaware | 3.8 /100 | #233 | Tragic $40,778 |
| Immigrants | West Indies | 3.7 /100 | #234 | Tragic $40,763 |
| Immigrants | Guyana | 3.6 /100 | #235 | Tragic $40,742 |
| Immigrants | Nonimmigrants | 3.4 /100 | #236 | Tragic $40,669 |
Demographics Similar to Central Americans by Per Capita Income
In terms of per capita income, the demographic groups most similar to Central Americans are Immigrants from Cabo Verde ($38,540, a difference of 0.050%), Immigrants from Belize ($38,614, a difference of 0.14%), Nepalese ($38,442, a difference of 0.31%), Immigrants from El Salvador ($38,394, a difference of 0.43%), and Immigrants from Jamaica ($38,766, a difference of 0.53%).
| Demographics | Rating | Rank | Per Capita Income |
| Americans | 0.6 /100 | #264 | Tragic $39,039 |
| Spanish Americans | 0.5 /100 | #265 | Tragic $39,012 |
| Salvadorans | 0.5 /100 | #266 | Tragic $38,858 |
| Immigrants | Zaire | 0.4 /100 | #267 | Tragic $38,848 |
| Liberians | 0.4 /100 | #268 | Tragic $38,780 |
| Immigrants | Jamaica | 0.4 /100 | #269 | Tragic $38,766 |
| Immigrants | Belize | 0.3 /100 | #270 | Tragic $38,614 |
| Central Americans | 0.3 /100 | #271 | Tragic $38,560 |
| Immigrants | Cabo Verde | 0.3 /100 | #272 | Tragic $38,540 |
| Nepalese | 0.3 /100 | #273 | Tragic $38,442 |
| Immigrants | El Salvador | 0.3 /100 | #274 | Tragic $38,394 |
| Immigrants | Liberia | 0.2 /100 | #275 | Tragic $38,165 |
| Hmong | 0.2 /100 | #276 | Tragic $38,120 |
| Comanche | 0.2 /100 | #277 | Tragic $38,088 |
| Immigrants | Nicaragua | 0.2 /100 | #278 | Tragic $38,065 |