Nicaraguan vs Belizean Child Poverty Among Boys Under 16
COMPARE
Nicaraguan
Belizean
Child Poverty Among Boys Under 16
Child Poverty Among Boys Under 16 Comparison
Nicaraguans
Belizeans
18.4%
CHILD POVERTY AMONG BOYS UNDER 16
1.4/ 100
METRIC RATING
231st/ 347
METRIC RANK
19.9%
CHILD POVERTY AMONG BOYS UNDER 16
0.1/ 100
METRIC RATING
273rd/ 347
METRIC RANK
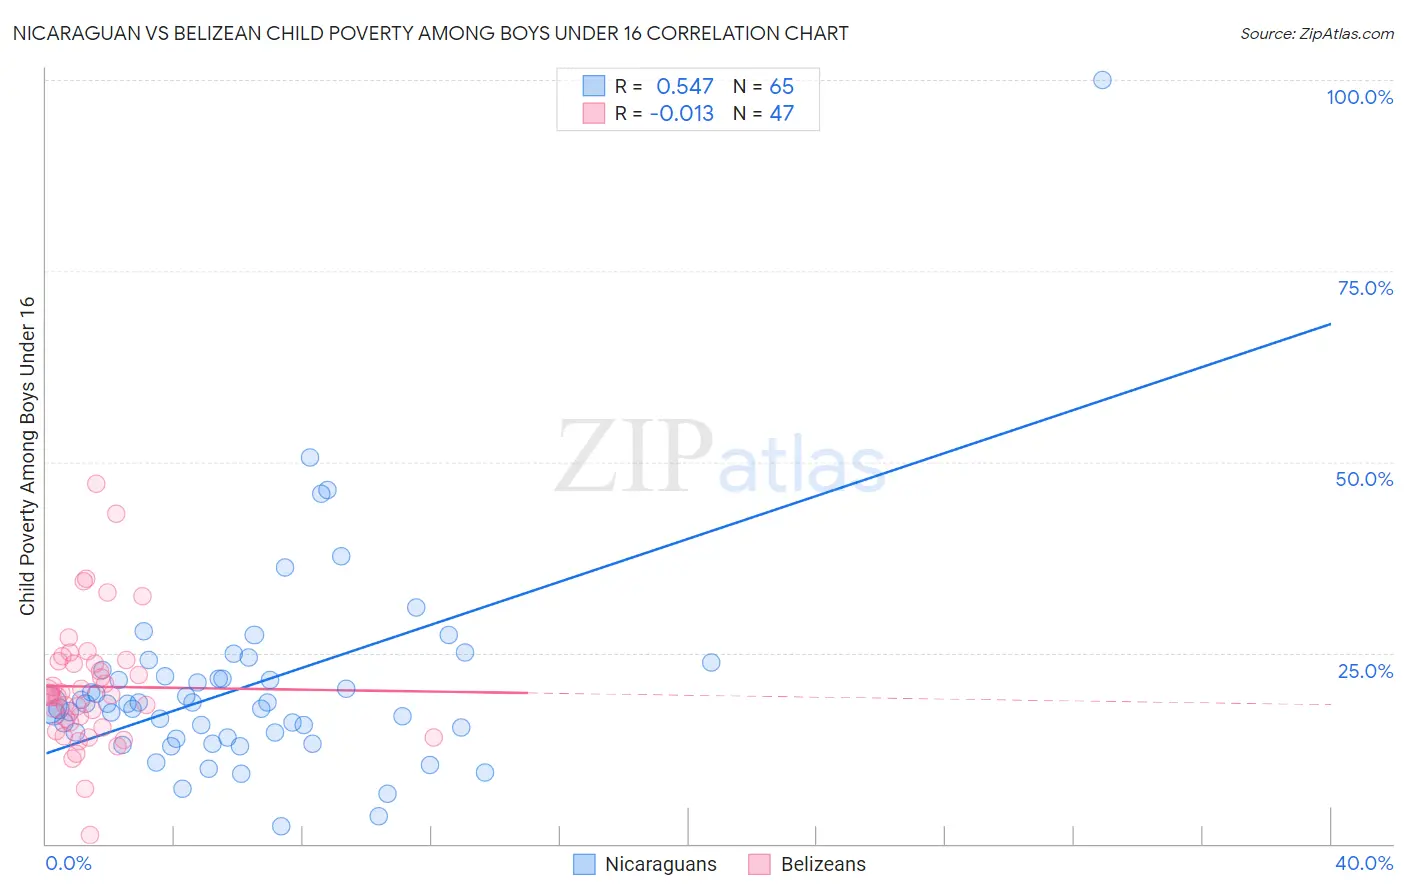
Nicaraguan vs Belizean Child Poverty Among Boys Under 16 Correlation Chart
The statistical analysis conducted on geographies consisting of 283,666,895 people shows a substantial positive correlation between the proportion of Nicaraguans and poverty level among boys under the age of 16 in the United States with a correlation coefficient (R) of 0.547 and weighted average of 18.4%. Similarly, the statistical analysis conducted on geographies consisting of 143,705,022 people shows no correlation between the proportion of Belizeans and poverty level among boys under the age of 16 in the United States with a correlation coefficient (R) of -0.013 and weighted average of 19.9%, a difference of 8.2%.
Child Poverty Among Boys Under 16 Correlation Summary
| Measurement | Nicaraguan | Belizean |
| Minimum | 2.3% | 1.2% |
| Maximum | 100.0% | 47.1% |
| Range | 97.7% | 45.9% |
| Mean | 20.6% | 20.6% |
| Median | 18.3% | 19.5% |
| Interquartile 25% (IQ1) | 14.3% | 15.2% |
| Interquartile 75% (IQ3) | 22.4% | 23.8% |
| Interquartile Range (IQR) | 8.1% | 8.6% |
| Standard Deviation (Sample) | 13.5% | 8.4% |
| Standard Deviation (Population) | 13.4% | 8.3% |
Similar Demographics by Child Poverty Among Boys Under 16
Demographics Similar to Nicaraguans by Child Poverty Among Boys Under 16
In terms of child poverty among boys under 16, the demographic groups most similar to Nicaraguans are Marshallese (18.4%, a difference of 0.20%), Immigrants from Nigeria (18.4%, a difference of 0.39%), Immigrants from Micronesia (18.3%, a difference of 0.53%), Fijian (18.3%, a difference of 0.53%), and Nigerian (18.5%, a difference of 0.64%).
| Demographics | Rating | Rank | Child Poverty Among Boys Under 16 |
| Nepalese | 3.2 /100 | #224 | Tragic 18.0% |
| Inupiat | 2.7 /100 | #225 | Tragic 18.1% |
| Immigrants | Africa | 2.6 /100 | #226 | Tragic 18.1% |
| Bermudans | 2.5 /100 | #227 | Tragic 18.1% |
| Immigrants | Nonimmigrants | 2.2 /100 | #228 | Tragic 18.2% |
| Immigrants | Micronesia | 1.8 /100 | #229 | Tragic 18.3% |
| Fijians | 1.8 /100 | #230 | Tragic 18.3% |
| Nicaraguans | 1.4 /100 | #231 | Tragic 18.4% |
| Marshallese | 1.3 /100 | #232 | Tragic 18.4% |
| Immigrants | Nigeria | 1.2 /100 | #233 | Tragic 18.4% |
| Nigerians | 1.1 /100 | #234 | Tragic 18.5% |
| Americans | 0.9 /100 | #235 | Tragic 18.6% |
| Sudanese | 0.9 /100 | #236 | Tragic 18.6% |
| Immigrants | Eritrea | 0.8 /100 | #237 | Tragic 18.6% |
| Immigrants | Laos | 0.8 /100 | #238 | Tragic 18.7% |
Demographics Similar to Belizeans by Child Poverty Among Boys Under 16
In terms of child poverty among boys under 16, the demographic groups most similar to Belizeans are Immigrants from Ecuador (19.8%, a difference of 0.14%), Immigrants from Bangladesh (19.9%, a difference of 0.25%), Chickasaw (19.8%, a difference of 0.36%), Jamaican (20.0%, a difference of 0.38%), and Subsaharan African (20.0%, a difference of 0.55%).
| Demographics | Rating | Rank | Child Poverty Among Boys Under 16 |
| Immigrants | El Salvador | 0.1 /100 | #266 | Tragic 19.6% |
| Vietnamese | 0.1 /100 | #267 | Tragic 19.6% |
| Spanish American Indians | 0.1 /100 | #268 | Tragic 19.6% |
| Immigrants | Cabo Verde | 0.1 /100 | #269 | Tragic 19.7% |
| Cherokee | 0.1 /100 | #270 | Tragic 19.7% |
| Chickasaw | 0.1 /100 | #271 | Tragic 19.8% |
| Immigrants | Ecuador | 0.1 /100 | #272 | Tragic 19.8% |
| Belizeans | 0.1 /100 | #273 | Tragic 19.9% |
| Immigrants | Bangladesh | 0.0 /100 | #274 | Tragic 19.9% |
| Jamaicans | 0.0 /100 | #275 | Tragic 20.0% |
| Sub-Saharan Africans | 0.0 /100 | #276 | Tragic 20.0% |
| Immigrants | Barbados | 0.0 /100 | #277 | Tragic 20.0% |
| Immigrants | West Indies | 0.0 /100 | #278 | Tragic 20.0% |
| Bangladeshis | 0.0 /100 | #279 | Tragic 20.0% |
| Central Americans | 0.0 /100 | #280 | Tragic 20.1% |