New Zealander vs Taiwanese Householder Income Ages 45 - 64 years
COMPARE
New Zealander
Taiwanese
Householder Income Ages 45 - 64 years
Householder Income Ages 45 - 64 years Comparison
New Zealanders
Taiwanese
$111,286
HOUSEHOLDER INCOME AGES 45 - 64 YEARS
99.6/ 100
METRIC RATING
66th/ 347
METRIC RANK
$104,180
HOUSEHOLDER INCOME AGES 45 - 64 YEARS
87.4/ 100
METRIC RATING
136th/ 347
METRIC RANK
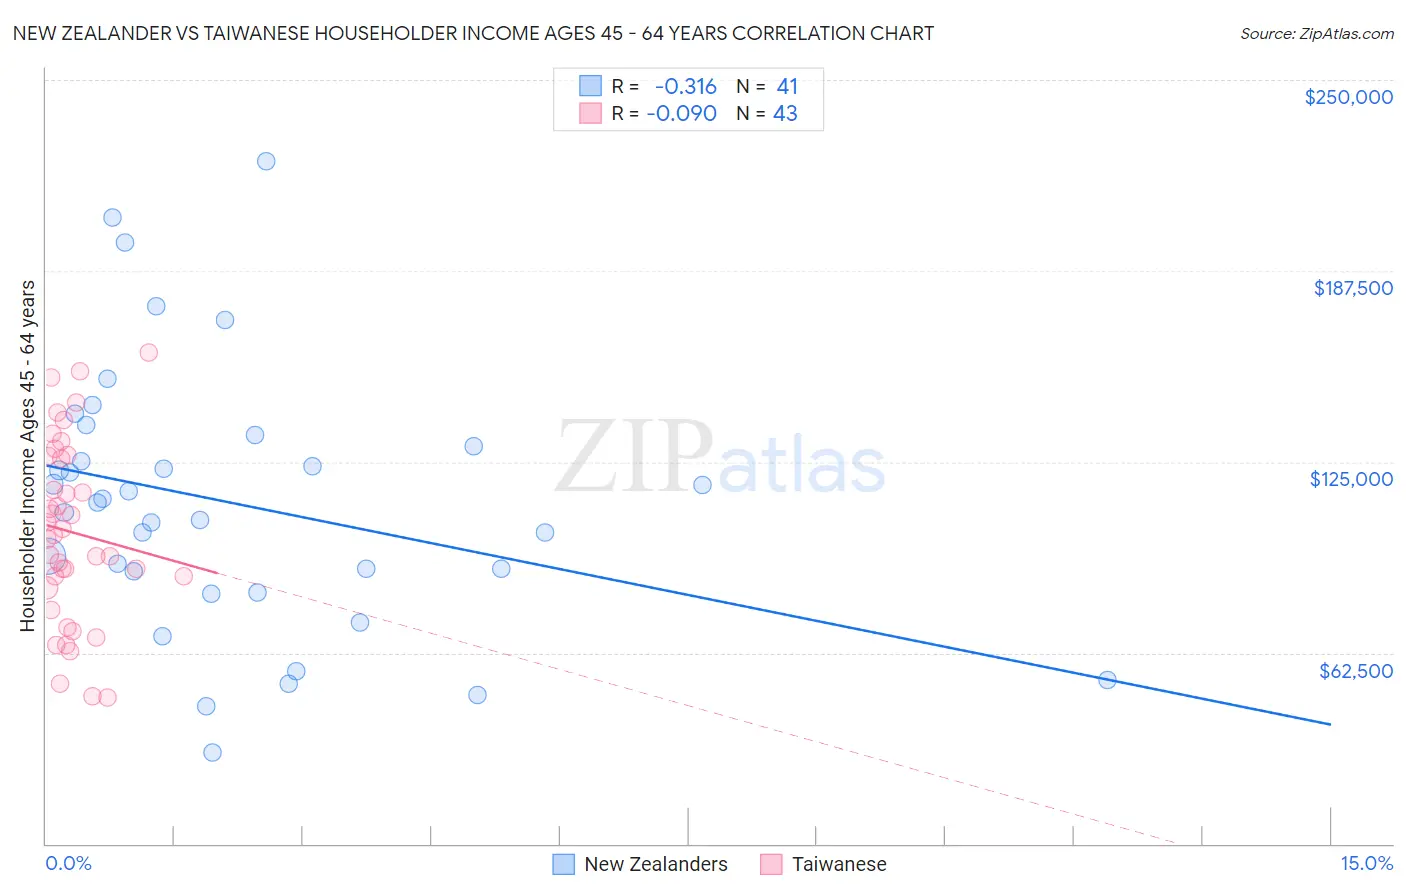
New Zealander vs Taiwanese Householder Income Ages 45 - 64 years Correlation Chart
The statistical analysis conducted on geographies consisting of 106,839,275 people shows a mild negative correlation between the proportion of New Zealanders and household income with householder between the ages 45 and 64 in the United States with a correlation coefficient (R) of -0.316 and weighted average of $111,286. Similarly, the statistical analysis conducted on geographies consisting of 31,709,295 people shows a slight negative correlation between the proportion of Taiwanese and household income with householder between the ages 45 and 64 in the United States with a correlation coefficient (R) of -0.090 and weighted average of $104,180, a difference of 6.8%.
Householder Income Ages 45 - 64 years Correlation Summary
| Measurement | New Zealander | Taiwanese |
| Minimum | $29,688 | $47,813 |
| Maximum | $223,409 | $160,833 |
| Range | $193,721 | $113,020 |
| Mean | $111,423 | $102,027 |
| Median | $111,501 | $100,891 |
| Interquartile 25% (IQ1) | $85,594 | $83,846 |
| Interquartile 75% (IQ3) | $131,875 | $126,896 |
| Interquartile Range (IQR) | $46,281 | $43,050 |
| Standard Deviation (Sample) | $43,171 | $29,530 |
| Standard Deviation (Population) | $42,642 | $29,184 |
Similar Demographics by Householder Income Ages 45 - 64 years
Demographics Similar to New Zealanders by Householder Income Ages 45 - 64 years
In terms of householder income ages 45 - 64 years, the demographic groups most similar to New Zealanders are Immigrants from Belarus ($111,430, a difference of 0.13%), Immigrants from Latvia ($111,454, a difference of 0.15%), Laotian ($111,051, a difference of 0.21%), Mongolian ($111,602, a difference of 0.28%), and Immigrants from Norway ($111,669, a difference of 0.34%).
| Demographics | Rating | Rank | Householder Income Ages 45 - 64 years |
| Immigrants | Europe | 99.7 /100 | #59 | Exceptional $111,984 |
| Immigrants | Netherlands | 99.7 /100 | #60 | Exceptional $111,982 |
| Immigrants | Czechoslovakia | 99.7 /100 | #61 | Exceptional $111,914 |
| Immigrants | Norway | 99.7 /100 | #62 | Exceptional $111,669 |
| Mongolians | 99.6 /100 | #63 | Exceptional $111,602 |
| Immigrants | Latvia | 99.6 /100 | #64 | Exceptional $111,454 |
| Immigrants | Belarus | 99.6 /100 | #65 | Exceptional $111,430 |
| New Zealanders | 99.6 /100 | #66 | Exceptional $111,286 |
| Laotians | 99.5 /100 | #67 | Exceptional $111,051 |
| Immigrants | Romania | 99.4 /100 | #68 | Exceptional $110,633 |
| Immigrants | Italy | 99.4 /100 | #69 | Exceptional $110,434 |
| Koreans | 99.3 /100 | #70 | Exceptional $110,334 |
| Italians | 99.3 /100 | #71 | Exceptional $110,224 |
| Assyrians/Chaldeans/Syriacs | 99.3 /100 | #72 | Exceptional $110,201 |
| Argentineans | 99.3 /100 | #73 | Exceptional $110,103 |
Demographics Similar to Taiwanese by Householder Income Ages 45 - 64 years
In terms of householder income ages 45 - 64 years, the demographic groups most similar to Taiwanese are Brazilian ($104,408, a difference of 0.22%), Hungarian ($103,913, a difference of 0.26%), Canadian ($104,560, a difference of 0.36%), Arab ($104,566, a difference of 0.37%), and Ethiopian ($103,736, a difference of 0.43%).
| Demographics | Rating | Rank | Householder Income Ages 45 - 64 years |
| Peruvians | 91.5 /100 | #129 | Exceptional $105,070 |
| Immigrants | Zimbabwe | 91.2 /100 | #130 | Exceptional $104,992 |
| Immigrants | Syria | 90.7 /100 | #131 | Exceptional $104,858 |
| Lebanese | 90.1 /100 | #132 | Exceptional $104,734 |
| Arabs | 89.3 /100 | #133 | Excellent $104,566 |
| Canadians | 89.3 /100 | #134 | Excellent $104,560 |
| Brazilians | 88.6 /100 | #135 | Excellent $104,408 |
| Taiwanese | 87.4 /100 | #136 | Excellent $104,180 |
| Hungarians | 85.8 /100 | #137 | Excellent $103,913 |
| Ethiopians | 84.7 /100 | #138 | Excellent $103,736 |
| Immigrants | Oceania | 84.5 /100 | #139 | Excellent $103,705 |
| Norwegians | 84.3 /100 | #140 | Excellent $103,682 |
| Immigrants | Uganda | 83.7 /100 | #141 | Excellent $103,584 |
| Luxembourgers | 83.3 /100 | #142 | Excellent $103,536 |
| Serbians | 83.2 /100 | #143 | Excellent $103,522 |