Nepalese vs Immigrants from Iran Median Household Income
COMPARE
Nepalese
Immigrants from Iran
Median Household Income
Median Household Income Comparison
Nepalese
Immigrants from Iran
$82,410
MEDIAN HOUSEHOLD INCOME
15.1/ 100
METRIC RATING
213th/ 347
METRIC RANK
$108,055
MEDIAN HOUSEHOLD INCOME
100.0/ 100
METRIC RATING
8th/ 347
METRIC RANK
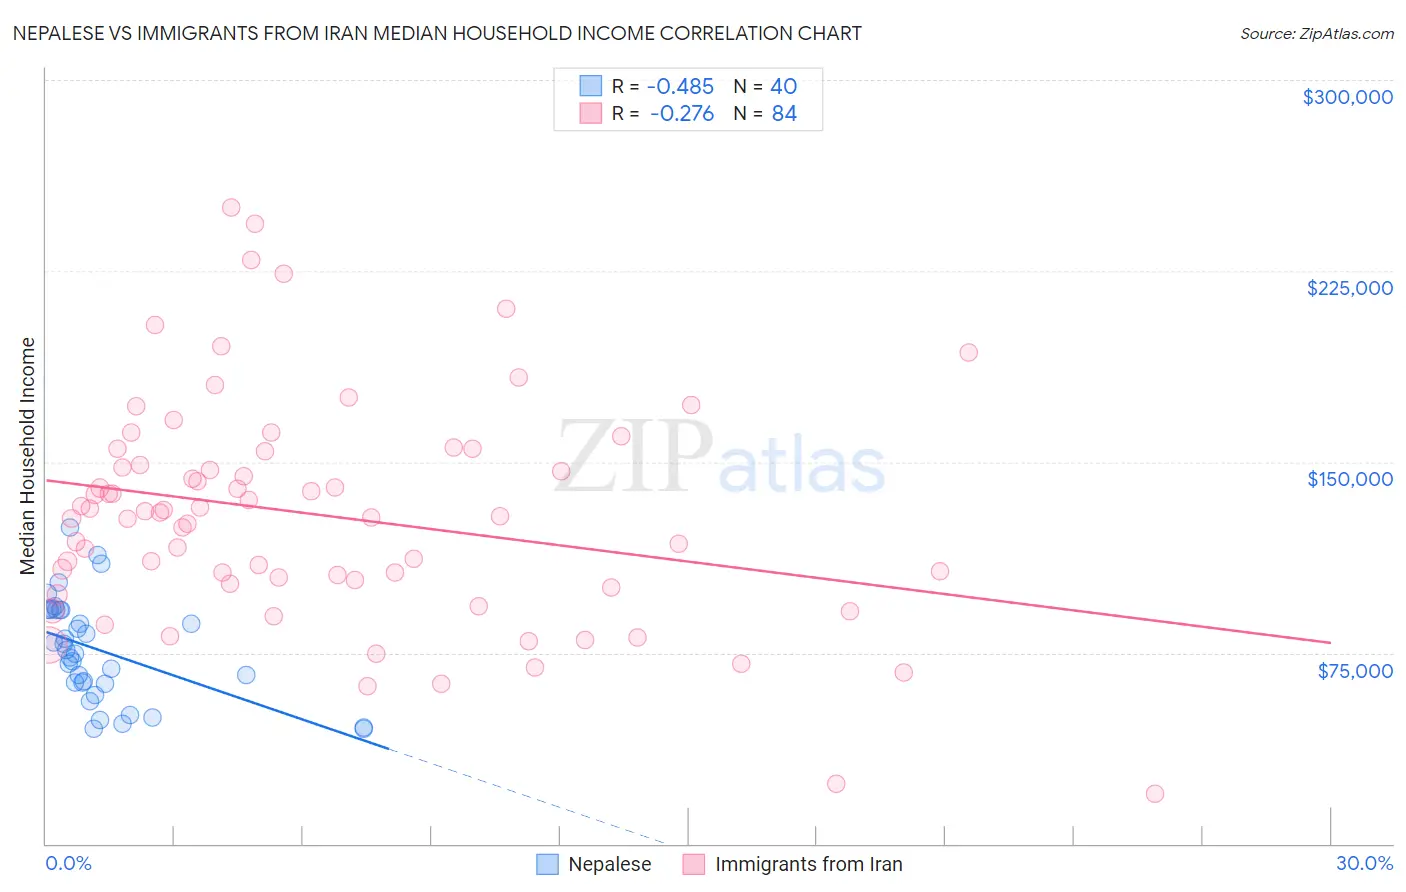
Nepalese vs Immigrants from Iran Median Household Income Correlation Chart
The statistical analysis conducted on geographies consisting of 24,521,755 people shows a moderate negative correlation between the proportion of Nepalese and median household income in the United States with a correlation coefficient (R) of -0.485 and weighted average of $82,410. Similarly, the statistical analysis conducted on geographies consisting of 279,821,960 people shows a weak negative correlation between the proportion of Immigrants from Iran and median household income in the United States with a correlation coefficient (R) of -0.276 and weighted average of $108,055, a difference of 31.1%.
Median Household Income Correlation Summary
| Measurement | Nepalese | Immigrants from Iran |
| Minimum | $45,000 | $19,722 |
| Maximum | $124,273 | $250,001 |
| Range | $79,273 | $230,279 |
| Mean | $75,935 | $128,949 |
| Median | $75,316 | $129,200 |
| Interquartile 25% (IQ1) | $63,001 | $102,878 |
| Interquartile 75% (IQ3) | $91,848 | $151,481 |
| Interquartile Range (IQR) | $28,847 | $48,604 |
| Standard Deviation (Sample) | $20,077 | $44,216 |
| Standard Deviation (Population) | $19,825 | $43,952 |
Similar Demographics by Median Household Income
Demographics Similar to Nepalese by Median Household Income
In terms of median household income, the demographic groups most similar to Nepalese are Venezuelan ($82,432, a difference of 0.030%), Salvadoran ($82,449, a difference of 0.050%), Panamanian ($82,272, a difference of 0.17%), Immigrants from Uruguay ($82,560, a difference of 0.18%), and Vietnamese ($82,248, a difference of 0.20%).
| Demographics | Rating | Rank | Median Household Income |
| Immigrants | Kenya | 21.3 /100 | #206 | Fair $83,068 |
| Dutch | 20.3 /100 | #207 | Fair $82,971 |
| French Canadians | 18.7 /100 | #208 | Poor $82,810 |
| Immigrants | Iraq | 16.7 /100 | #209 | Poor $82,594 |
| Immigrants | Uruguay | 16.4 /100 | #210 | Poor $82,560 |
| Salvadorans | 15.4 /100 | #211 | Poor $82,449 |
| Venezuelans | 15.3 /100 | #212 | Poor $82,432 |
| Nepalese | 15.1 /100 | #213 | Poor $82,410 |
| Panamanians | 14.0 /100 | #214 | Poor $82,272 |
| Vietnamese | 13.8 /100 | #215 | Poor $82,248 |
| Yugoslavians | 13.3 /100 | #216 | Poor $82,186 |
| Ecuadorians | 12.5 /100 | #217 | Poor $82,070 |
| Whites/Caucasians | 12.2 /100 | #218 | Poor $82,029 |
| Nigerians | 10.3 /100 | #219 | Poor $81,725 |
| Immigrants | Venezuela | 9.0 /100 | #220 | Tragic $81,506 |
Demographics Similar to Immigrants from Iran by Median Household Income
In terms of median household income, the demographic groups most similar to Immigrants from Iran are Okinawan ($106,624, a difference of 1.3%), Iranian ($109,835, a difference of 1.7%), Immigrants from South Central Asia ($106,057, a difference of 1.9%), Immigrants from Singapore ($110,428, a difference of 2.2%), and Thai ($110,648, a difference of 2.4%).
| Demographics | Rating | Rank | Median Household Income |
| Immigrants | Taiwan | 100.0 /100 | #1 | Exceptional $116,460 |
| Filipinos | 100.0 /100 | #2 | Exceptional $115,509 |
| Immigrants | India | 100.0 /100 | #3 | Exceptional $113,009 |
| Immigrants | Hong Kong | 100.0 /100 | #4 | Exceptional $111,519 |
| Thais | 100.0 /100 | #5 | Exceptional $110,648 |
| Immigrants | Singapore | 100.0 /100 | #6 | Exceptional $110,428 |
| Iranians | 100.0 /100 | #7 | Exceptional $109,835 |
| Immigrants | Iran | 100.0 /100 | #8 | Exceptional $108,055 |
| Okinawans | 100.0 /100 | #9 | Exceptional $106,624 |
| Immigrants | South Central Asia | 100.0 /100 | #10 | Exceptional $106,057 |
| Immigrants | China | 100.0 /100 | #11 | Exceptional $105,335 |
| Indians (Asian) | 100.0 /100 | #12 | Exceptional $105,262 |
| Immigrants | Eastern Asia | 100.0 /100 | #13 | Exceptional $104,796 |
| Immigrants | Ireland | 100.0 /100 | #14 | Exceptional $104,692 |
| Immigrants | Israel | 100.0 /100 | #15 | Exceptional $104,090 |