Navajo vs Scottish Median Female Earnings
COMPARE
Navajo
Scottish
Median Female Earnings
Median Female Earnings Comparison
Navajo
Scottish
$33,046
MEDIAN FEMALE EARNINGS
0.0/ 100
METRIC RATING
341st/ 347
METRIC RANK
$38,397
MEDIAN FEMALE EARNINGS
6.3/ 100
METRIC RATING
227th/ 347
METRIC RANK
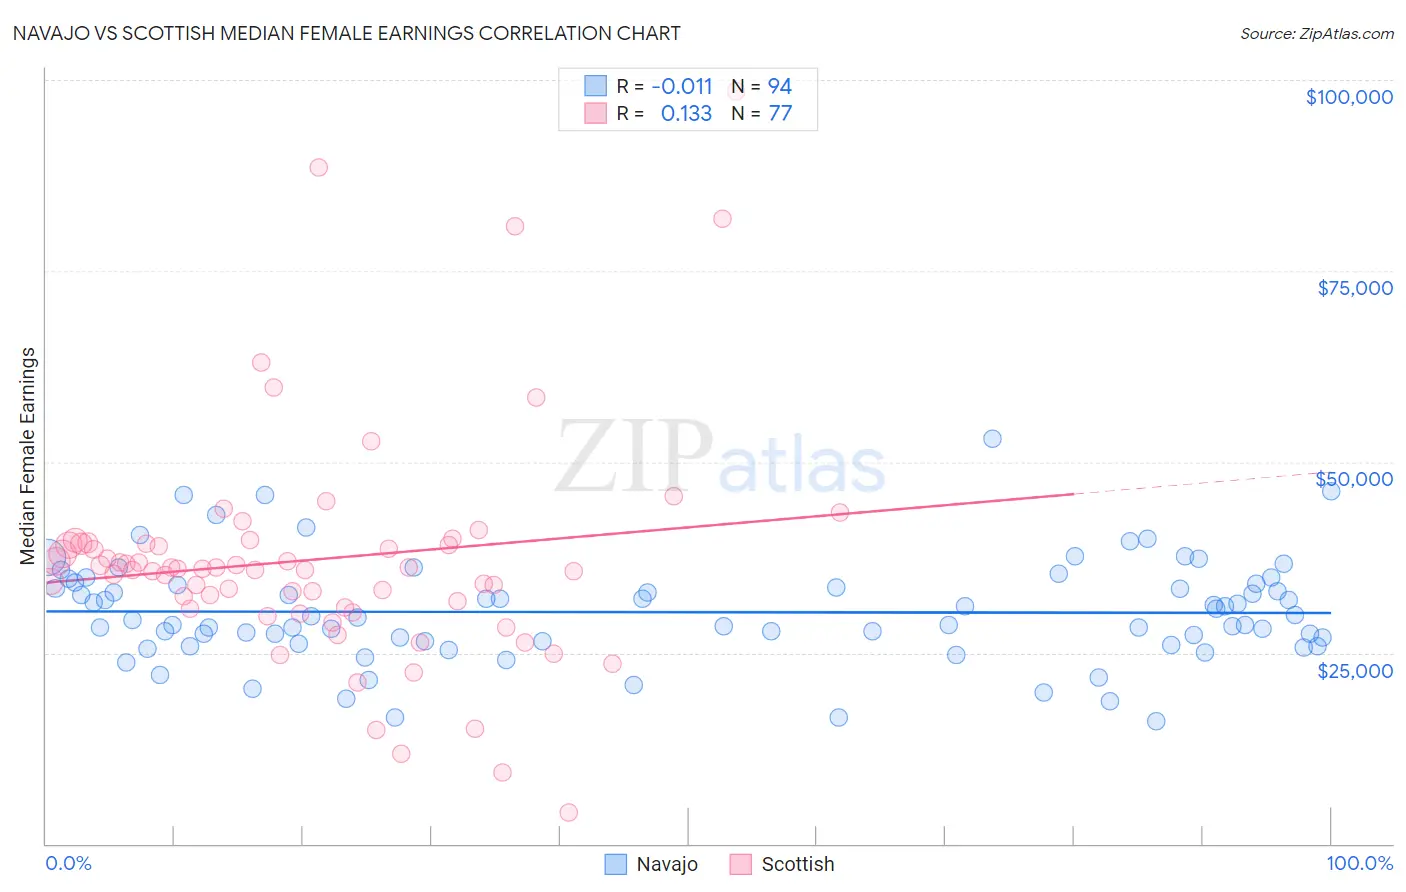
Navajo vs Scottish Median Female Earnings Correlation Chart
The statistical analysis conducted on geographies consisting of 224,729,121 people shows no correlation between the proportion of Navajo and median female earnings in the United States with a correlation coefficient (R) of -0.011 and weighted average of $33,046. Similarly, the statistical analysis conducted on geographies consisting of 565,316,168 people shows a poor positive correlation between the proportion of Scottish and median female earnings in the United States with a correlation coefficient (R) of 0.133 and weighted average of $38,397, a difference of 16.2%.
Median Female Earnings Correlation Summary
| Measurement | Navajo | Scottish |
| Minimum | $16,070 | $4,115 |
| Maximum | $52,969 | $98,472 |
| Range | $36,899 | $94,357 |
| Mean | $30,327 | $37,218 |
| Median | $29,421 | $35,990 |
| Interquartile 25% (IQ1) | $26,466 | $30,914 |
| Interquartile 75% (IQ3) | $33,883 | $39,333 |
| Interquartile Range (IQR) | $7,417 | $8,419 |
| Standard Deviation (Sample) | $6,718 | $15,319 |
| Standard Deviation (Population) | $6,682 | $15,219 |
Similar Demographics by Median Female Earnings
Demographics Similar to Navajo by Median Female Earnings
In terms of median female earnings, the demographic groups most similar to Navajo are Tohono O'odham ($33,205, a difference of 0.48%), Immigrants from Mexico ($33,236, a difference of 0.57%), Immigrants from Cuba ($33,291, a difference of 0.74%), Yakama ($33,354, a difference of 0.93%), and Yup'ik ($32,730, a difference of 0.96%).
| Demographics | Rating | Rank | Median Female Earnings |
| Mexicans | 0.0 /100 | #333 | Tragic $33,664 |
| Spanish American Indians | 0.0 /100 | #334 | Tragic $33,625 |
| Creek | 0.0 /100 | #335 | Tragic $33,437 |
| Ottawa | 0.0 /100 | #336 | Tragic $33,378 |
| Yakama | 0.0 /100 | #337 | Tragic $33,354 |
| Immigrants | Cuba | 0.0 /100 | #338 | Tragic $33,291 |
| Immigrants | Mexico | 0.0 /100 | #339 | Tragic $33,236 |
| Tohono O'odham | 0.0 /100 | #340 | Tragic $33,205 |
| Navajo | 0.0 /100 | #341 | Tragic $33,046 |
| Yup'ik | 0.0 /100 | #342 | Tragic $32,730 |
| Pueblo | 0.0 /100 | #343 | Tragic $32,564 |
| Lumbee | 0.0 /100 | #344 | Tragic $32,500 |
| Puerto Ricans | 0.0 /100 | #345 | Tragic $31,560 |
| Arapaho | 0.0 /100 | #346 | Tragic $31,489 |
| Houma | 0.0 /100 | #347 | Tragic $30,343 |
Demographics Similar to Scottish by Median Female Earnings
In terms of median female earnings, the demographic groups most similar to Scottish are Subsaharan African ($38,391, a difference of 0.020%), Belgian ($38,382, a difference of 0.040%), French Canadian ($38,436, a difference of 0.10%), Basque ($38,352, a difference of 0.12%), and French ($38,457, a difference of 0.15%).
| Demographics | Rating | Rank | Median Female Earnings |
| Yugoslavians | 8.8 /100 | #220 | Tragic $38,573 |
| Immigrants | Azores | 8.8 /100 | #221 | Tragic $38,573 |
| Japanese | 8.1 /100 | #222 | Tragic $38,528 |
| Immigrants | Sudan | 7.8 /100 | #223 | Tragic $38,511 |
| Native Hawaiians | 7.1 /100 | #224 | Tragic $38,461 |
| French | 7.0 /100 | #225 | Tragic $38,457 |
| French Canadians | 6.8 /100 | #226 | Tragic $38,436 |
| Scottish | 6.3 /100 | #227 | Tragic $38,397 |
| Sub-Saharan Africans | 6.2 /100 | #228 | Tragic $38,391 |
| Belgians | 6.1 /100 | #229 | Tragic $38,382 |
| Basques | 5.7 /100 | #230 | Tragic $38,352 |
| Somalis | 5.5 /100 | #231 | Tragic $38,333 |
| Scandinavians | 5.2 /100 | #232 | Tragic $38,306 |
| Tongans | 5.1 /100 | #233 | Tragic $38,288 |
| Celtics | 5.0 /100 | #234 | Tragic $38,283 |