Mongolian vs Cheyenne Householder Income Over 65 years
COMPARE
Mongolian
Cheyenne
Householder Income Over 65 years
Householder Income Over 65 years Comparison
Mongolians
Cheyenne
$65,326
HOUSEHOLDER INCOME OVER 65 YEARS
99.0/ 100
METRIC RATING
70th/ 347
METRIC RANK
$54,096
HOUSEHOLDER INCOME OVER 65 YEARS
0.1/ 100
METRIC RATING
277th/ 347
METRIC RANK
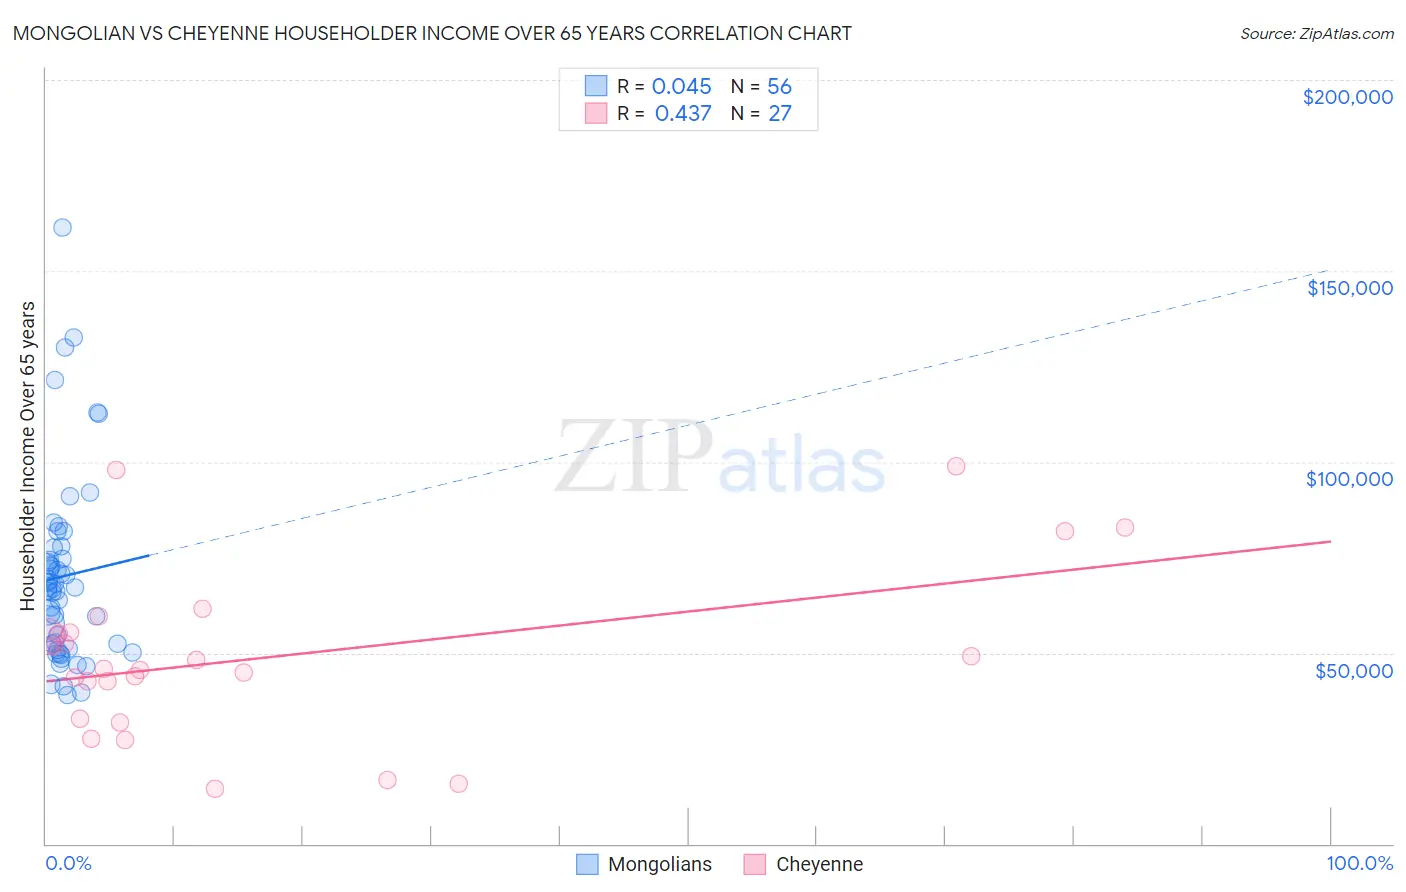
Mongolian vs Cheyenne Householder Income Over 65 years Correlation Chart
The statistical analysis conducted on geographies consisting of 140,116,166 people shows no correlation between the proportion of Mongolians and household income with householder over the age of 65 in the United States with a correlation coefficient (R) of 0.045 and weighted average of $65,326. Similarly, the statistical analysis conducted on geographies consisting of 80,656,378 people shows a moderate positive correlation between the proportion of Cheyenne and household income with householder over the age of 65 in the United States with a correlation coefficient (R) of 0.437 and weighted average of $54,096, a difference of 20.8%.
Householder Income Over 65 years Correlation Summary
| Measurement | Mongolian | Cheyenne |
| Minimum | $39,115 | $14,422 |
| Maximum | $161,250 | $98,750 |
| Range | $122,135 | $84,328 |
| Mean | $70,084 | $48,996 |
| Median | $66,894 | $45,764 |
| Interquartile 25% (IQ1) | $51,691 | $32,697 |
| Interquartile 75% (IQ3) | $76,091 | $55,318 |
| Interquartile Range (IQR) | $24,400 | $22,620 |
| Standard Deviation (Sample) | $24,736 | $21,930 |
| Standard Deviation (Population) | $24,514 | $21,520 |
Similar Demographics by Householder Income Over 65 years
Demographics Similar to Mongolians by Householder Income Over 65 years
In terms of householder income over 65 years, the demographic groups most similar to Mongolians are Greek ($65,306, a difference of 0.030%), Argentinean ($65,246, a difference of 0.12%), Immigrants from Ethiopia ($65,238, a difference of 0.13%), Samoan ($65,427, a difference of 0.15%), and Egyptian ($65,441, a difference of 0.18%).
| Demographics | Rating | Rank | Householder Income Over 65 years |
| Marshallese | 99.4 /100 | #63 | Exceptional $65,874 |
| Zimbabweans | 99.4 /100 | #64 | Exceptional $65,854 |
| Immigrants | England | 99.3 /100 | #65 | Exceptional $65,715 |
| South Africans | 99.3 /100 | #66 | Exceptional $65,652 |
| Immigrants | Malaysia | 99.1 /100 | #67 | Exceptional $65,497 |
| Egyptians | 99.1 /100 | #68 | Exceptional $65,441 |
| Samoans | 99.1 /100 | #69 | Exceptional $65,427 |
| Mongolians | 99.0 /100 | #70 | Exceptional $65,326 |
| Greeks | 98.9 /100 | #71 | Exceptional $65,306 |
| Argentineans | 98.9 /100 | #72 | Exceptional $65,246 |
| Immigrants | Ethiopia | 98.9 /100 | #73 | Exceptional $65,238 |
| Lithuanians | 98.8 /100 | #74 | Exceptional $65,209 |
| Sierra Leoneans | 98.6 /100 | #75 | Exceptional $65,038 |
| Ethiopians | 98.5 /100 | #76 | Exceptional $64,989 |
| Immigrants | Canada | 98.5 /100 | #77 | Exceptional $64,952 |
Demographics Similar to Cheyenne by Householder Income Over 65 years
In terms of householder income over 65 years, the demographic groups most similar to Cheyenne are Cree ($54,129, a difference of 0.060%), Cherokee ($54,133, a difference of 0.070%), Barbadian ($54,163, a difference of 0.12%), Immigrants from Ecuador ($54,030, a difference of 0.12%), and Blackfeet ($54,029, a difference of 0.12%).
| Demographics | Rating | Rank | Householder Income Over 65 years |
| Immigrants | Senegal | 0.1 /100 | #270 | Tragic $54,447 |
| Liberians | 0.1 /100 | #271 | Tragic $54,356 |
| Potawatomi | 0.1 /100 | #272 | Tragic $54,212 |
| Indonesians | 0.1 /100 | #273 | Tragic $54,176 |
| Barbadians | 0.1 /100 | #274 | Tragic $54,163 |
| Cherokee | 0.1 /100 | #275 | Tragic $54,133 |
| Cree | 0.1 /100 | #276 | Tragic $54,129 |
| Cheyenne | 0.1 /100 | #277 | Tragic $54,096 |
| Immigrants | Ecuador | 0.1 /100 | #278 | Tragic $54,030 |
| Blackfeet | 0.1 /100 | #279 | Tragic $54,029 |
| Immigrants | Jamaica | 0.1 /100 | #280 | Tragic $54,027 |
| Somalis | 0.1 /100 | #281 | Tragic $54,004 |
| Immigrants | Armenia | 0.1 /100 | #282 | Tragic $53,974 |
| Immigrants | Liberia | 0.1 /100 | #283 | Tragic $53,967 |
| Immigrants | Guatemala | 0.1 /100 | #284 | Tragic $53,950 |