Immigrants from Cuba vs German Householder Income Ages 25 - 44 years
COMPARE
Immigrants from Cuba
German
Householder Income Ages 25 - 44 years
Householder Income Ages 25 - 44 years Comparison
Immigrants from Cuba
Germans
$76,701
HOUSEHOLDER INCOME AGES 25 - 44 YEARS
0.0/ 100
METRIC RATING
328th/ 347
METRIC RANK
$93,531
HOUSEHOLDER INCOME AGES 25 - 44 YEARS
36.0/ 100
METRIC RATING
184th/ 347
METRIC RANK
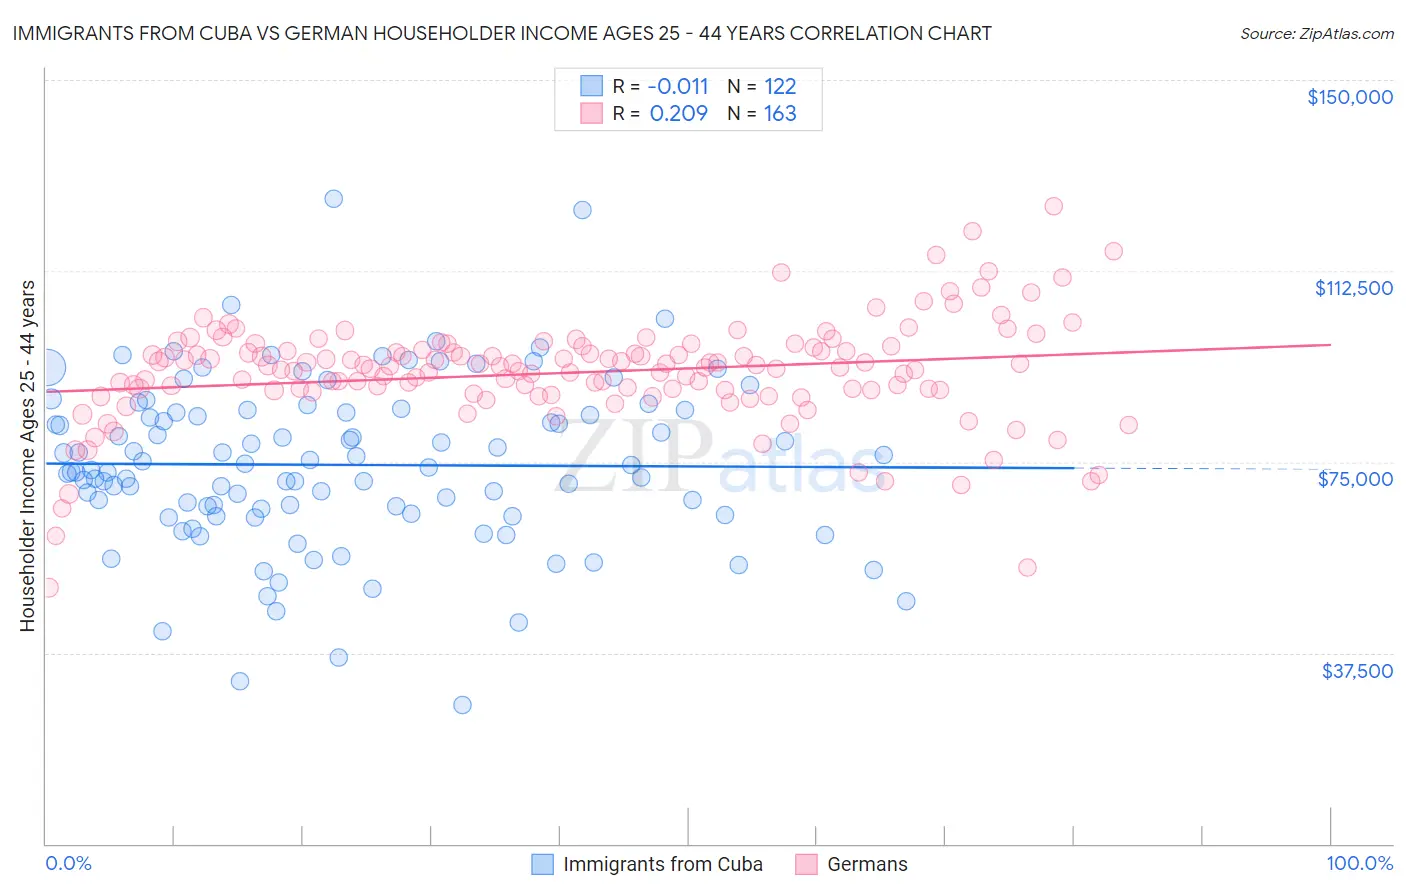
Immigrants from Cuba vs German Householder Income Ages 25 - 44 years Correlation Chart
The statistical analysis conducted on geographies consisting of 325,310,013 people shows no correlation between the proportion of Immigrants from Cuba and household income with householder between the ages 25 and 44 in the United States with a correlation coefficient (R) of -0.011 and weighted average of $76,701. Similarly, the statistical analysis conducted on geographies consisting of 573,342,679 people shows a weak positive correlation between the proportion of Germans and household income with householder between the ages 25 and 44 in the United States with a correlation coefficient (R) of 0.209 and weighted average of $93,531, a difference of 21.9%.
Householder Income Ages 25 - 44 years Correlation Summary
| Measurement | Immigrants from Cuba | German |
| Minimum | $27,269 | $50,351 |
| Maximum | $126,663 | $125,193 |
| Range | $99,394 | $74,841 |
| Mean | $74,412 | $92,516 |
| Median | $73,548 | $93,847 |
| Interquartile 25% (IQ1) | $64,878 | $89,053 |
| Interquartile 75% (IQ3) | $84,816 | $97,570 |
| Interquartile Range (IQR) | $19,938 | $8,517 |
| Standard Deviation (Sample) | $16,521 | $10,480 |
| Standard Deviation (Population) | $16,454 | $10,448 |
Similar Demographics by Householder Income Ages 25 - 44 years
Demographics Similar to Immigrants from Cuba by Householder Income Ages 25 - 44 years
In terms of householder income ages 25 - 44 years, the demographic groups most similar to Immigrants from Cuba are Seminole ($76,584, a difference of 0.15%), Immigrants from Bahamas ($76,910, a difference of 0.27%), Houma ($77,044, a difference of 0.45%), Sioux ($77,089, a difference of 0.51%), and Yakama ($76,226, a difference of 0.62%).
| Demographics | Rating | Rank | Householder Income Ages 25 - 44 years |
| Immigrants | Zaire | 0.0 /100 | #321 | Tragic $78,045 |
| Chickasaw | 0.0 /100 | #322 | Tragic $77,929 |
| Immigrants | Honduras | 0.0 /100 | #323 | Tragic $77,328 |
| Dutch West Indians | 0.0 /100 | #324 | Tragic $77,260 |
| Sioux | 0.0 /100 | #325 | Tragic $77,089 |
| Houma | 0.0 /100 | #326 | Tragic $77,044 |
| Immigrants | Bahamas | 0.0 /100 | #327 | Tragic $76,910 |
| Immigrants | Cuba | 0.0 /100 | #328 | Tragic $76,701 |
| Seminole | 0.0 /100 | #329 | Tragic $76,584 |
| Yakama | 0.0 /100 | #330 | Tragic $76,226 |
| Natives/Alaskans | 0.0 /100 | #331 | Tragic $75,647 |
| Bahamians | 0.0 /100 | #332 | Tragic $75,395 |
| Hopi | 0.0 /100 | #333 | Tragic $75,002 |
| Creek | 0.0 /100 | #334 | Tragic $74,847 |
| Kiowa | 0.0 /100 | #335 | Tragic $74,776 |
Demographics Similar to Germans by Householder Income Ages 25 - 44 years
In terms of householder income ages 25 - 44 years, the demographic groups most similar to Germans are Guamanian/Chamorro ($93,569, a difference of 0.040%), Immigrants from Eritrea ($93,466, a difference of 0.070%), Sierra Leonean ($93,435, a difference of 0.10%), Uruguayan ($93,631, a difference of 0.11%), and French ($93,665, a difference of 0.14%).
| Demographics | Rating | Rank | Householder Income Ages 25 - 44 years |
| Belgians | 45.8 /100 | #177 | Average $94,262 |
| Immigrants | South America | 42.8 /100 | #178 | Average $94,042 |
| French Canadians | 38.2 /100 | #179 | Fair $93,694 |
| French | 37.8 /100 | #180 | Fair $93,665 |
| Puget Sound Salish | 37.7 /100 | #181 | Fair $93,661 |
| Uruguayans | 37.3 /100 | #182 | Fair $93,631 |
| Guamanians/Chamorros | 36.5 /100 | #183 | Fair $93,569 |
| Germans | 36.0 /100 | #184 | Fair $93,531 |
| Immigrants | Eritrea | 35.2 /100 | #185 | Fair $93,466 |
| Sierra Leoneans | 34.8 /100 | #186 | Fair $93,435 |
| Spaniards | 34.0 /100 | #187 | Fair $93,366 |
| Immigrants | Sierra Leone | 30.9 /100 | #188 | Fair $93,115 |
| Dutch | 30.5 /100 | #189 | Fair $93,081 |
| Welsh | 30.0 /100 | #190 | Fair $93,039 |
| Tlingit-Haida | 29.4 /100 | #191 | Fair $92,987 |