Malaysian vs German Householder Income Ages 25 - 44 years
COMPARE
Malaysian
German
Householder Income Ages 25 - 44 years
Householder Income Ages 25 - 44 years Comparison
Malaysians
Germans
$88,291
HOUSEHOLDER INCOME AGES 25 - 44 YEARS
3.0/ 100
METRIC RATING
233rd/ 347
METRIC RANK
$93,531
HOUSEHOLDER INCOME AGES 25 - 44 YEARS
36.0/ 100
METRIC RATING
184th/ 347
METRIC RANK
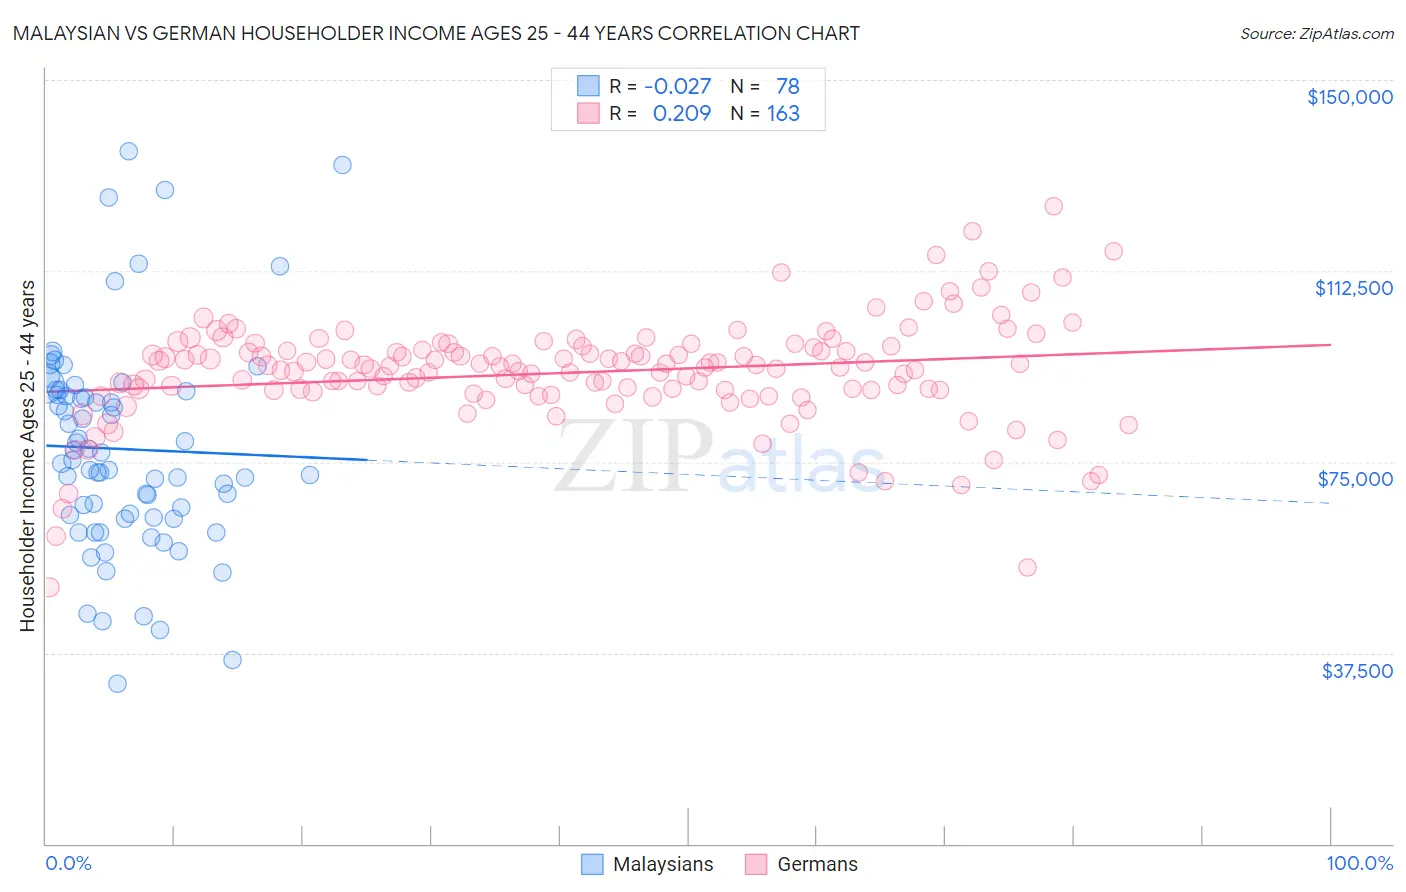
Malaysian vs German Householder Income Ages 25 - 44 years Correlation Chart
The statistical analysis conducted on geographies consisting of 225,821,746 people shows no correlation between the proportion of Malaysians and household income with householder between the ages 25 and 44 in the United States with a correlation coefficient (R) of -0.027 and weighted average of $88,291. Similarly, the statistical analysis conducted on geographies consisting of 573,342,679 people shows a weak positive correlation between the proportion of Germans and household income with householder between the ages 25 and 44 in the United States with a correlation coefficient (R) of 0.209 and weighted average of $93,531, a difference of 5.9%.
Householder Income Ages 25 - 44 years Correlation Summary
| Measurement | Malaysian | German |
| Minimum | $31,500 | $50,351 |
| Maximum | $135,944 | $125,193 |
| Range | $104,444 | $74,841 |
| Mean | $77,509 | $92,516 |
| Median | $74,995 | $93,847 |
| Interquartile 25% (IQ1) | $64,000 | $89,053 |
| Interquartile 75% (IQ3) | $88,750 | $97,570 |
| Interquartile Range (IQR) | $24,750 | $8,517 |
| Standard Deviation (Sample) | $20,820 | $10,480 |
| Standard Deviation (Population) | $20,686 | $10,448 |
Similar Demographics by Householder Income Ages 25 - 44 years
Demographics Similar to Malaysians by Householder Income Ages 25 - 44 years
In terms of householder income ages 25 - 44 years, the demographic groups most similar to Malaysians are Nonimmigrants ($88,301, a difference of 0.010%), Immigrants from Grenada ($88,311, a difference of 0.020%), Venezuelan ($88,232, a difference of 0.070%), Bermudan ($88,231, a difference of 0.070%), and Immigrants from Cameroon ($88,214, a difference of 0.090%).
| Demographics | Rating | Rank | Householder Income Ages 25 - 44 years |
| Immigrants | Iraq | 5.5 /100 | #226 | Tragic $89,444 |
| Immigrants | St. Vincent and the Grenadines | 4.1 /100 | #227 | Tragic $88,888 |
| Immigrants | Bosnia and Herzegovina | 4.0 /100 | #228 | Tragic $88,819 |
| Immigrants | Barbados | 3.7 /100 | #229 | Tragic $88,687 |
| Alaskan Athabascans | 3.3 /100 | #230 | Tragic $88,446 |
| Immigrants | Grenada | 3.0 /100 | #231 | Tragic $88,311 |
| Immigrants | Nonimmigrants | 3.0 /100 | #232 | Tragic $88,301 |
| Malaysians | 3.0 /100 | #233 | Tragic $88,291 |
| Venezuelans | 2.9 /100 | #234 | Tragic $88,232 |
| Bermudans | 2.9 /100 | #235 | Tragic $88,231 |
| Immigrants | Cameroon | 2.9 /100 | #236 | Tragic $88,214 |
| Salvadorans | 2.8 /100 | #237 | Tragic $88,198 |
| Alaska Natives | 2.6 /100 | #238 | Tragic $88,018 |
| Immigrants | Ghana | 2.2 /100 | #239 | Tragic $87,760 |
| Nicaraguans | 2.2 /100 | #240 | Tragic $87,751 |
Demographics Similar to Germans by Householder Income Ages 25 - 44 years
In terms of householder income ages 25 - 44 years, the demographic groups most similar to Germans are Guamanian/Chamorro ($93,569, a difference of 0.040%), Immigrants from Eritrea ($93,466, a difference of 0.070%), Sierra Leonean ($93,435, a difference of 0.10%), Uruguayan ($93,631, a difference of 0.11%), and French ($93,665, a difference of 0.14%).
| Demographics | Rating | Rank | Householder Income Ages 25 - 44 years |
| Belgians | 45.8 /100 | #177 | Average $94,262 |
| Immigrants | South America | 42.8 /100 | #178 | Average $94,042 |
| French Canadians | 38.2 /100 | #179 | Fair $93,694 |
| French | 37.8 /100 | #180 | Fair $93,665 |
| Puget Sound Salish | 37.7 /100 | #181 | Fair $93,661 |
| Uruguayans | 37.3 /100 | #182 | Fair $93,631 |
| Guamanians/Chamorros | 36.5 /100 | #183 | Fair $93,569 |
| Germans | 36.0 /100 | #184 | Fair $93,531 |
| Immigrants | Eritrea | 35.2 /100 | #185 | Fair $93,466 |
| Sierra Leoneans | 34.8 /100 | #186 | Fair $93,435 |
| Spaniards | 34.0 /100 | #187 | Fair $93,366 |
| Immigrants | Sierra Leone | 30.9 /100 | #188 | Fair $93,115 |
| Dutch | 30.5 /100 | #189 | Fair $93,081 |
| Welsh | 30.0 /100 | #190 | Fair $93,039 |
| Tlingit-Haida | 29.4 /100 | #191 | Fair $92,987 |