Menominee vs Immigrants from Ethiopia Householder Income Ages 45 - 64 years
COMPARE
Menominee
Immigrants from Ethiopia
Householder Income Ages 45 - 64 years
Householder Income Ages 45 - 64 years Comparison
Menominee
Immigrants from Ethiopia
$76,903
HOUSEHOLDER INCOME AGES 45 - 64 YEARS
0.0/ 100
METRIC RATING
334th/ 347
METRIC RANK
$102,763
HOUSEHOLDER INCOME AGES 45 - 64 YEARS
77.3/ 100
METRIC RATING
157th/ 347
METRIC RANK
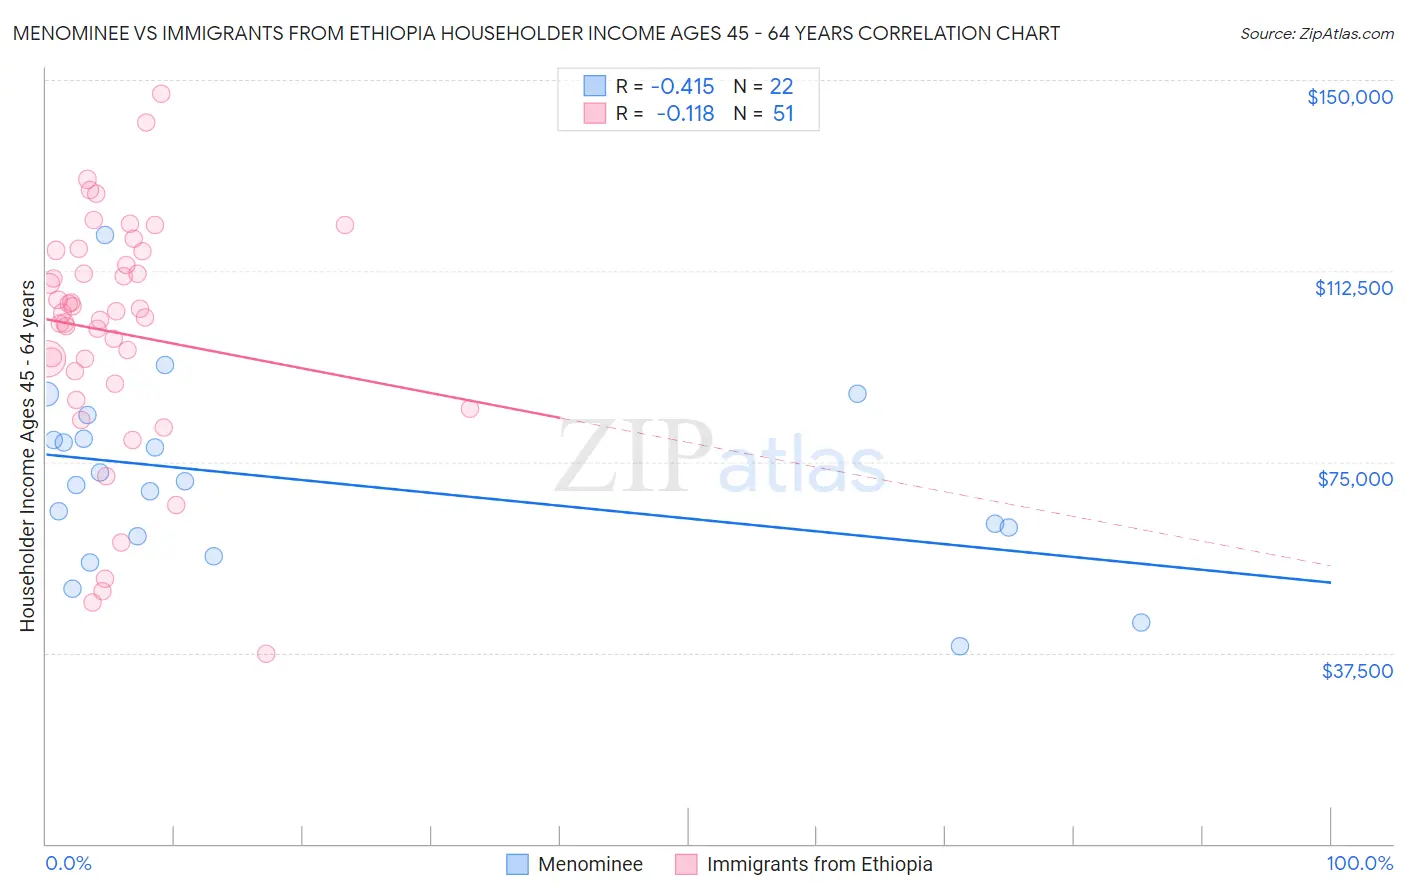
Menominee vs Immigrants from Ethiopia Householder Income Ages 45 - 64 years Correlation Chart
The statistical analysis conducted on geographies consisting of 45,774,690 people shows a moderate negative correlation between the proportion of Menominee and household income with householder between the ages 45 and 64 in the United States with a correlation coefficient (R) of -0.415 and weighted average of $76,903. Similarly, the statistical analysis conducted on geographies consisting of 211,332,039 people shows a poor negative correlation between the proportion of Immigrants from Ethiopia and household income with householder between the ages 45 and 64 in the United States with a correlation coefficient (R) of -0.118 and weighted average of $102,763, a difference of 33.6%.
Householder Income Ages 45 - 64 years Correlation Summary
| Measurement | Menominee | Immigrants from Ethiopia |
| Minimum | $38,750 | $37,206 |
| Maximum | $119,583 | $147,240 |
| Range | $80,833 | $110,034 |
| Mean | $71,291 | $100,387 |
| Median | $70,827 | $104,236 |
| Interquartile 25% (IQ1) | $60,417 | $90,455 |
| Interquartile 75% (IQ3) | $79,440 | $116,400 |
| Interquartile Range (IQR) | $19,023 | $25,945 |
| Standard Deviation (Sample) | $18,138 | $23,411 |
| Standard Deviation (Population) | $17,721 | $23,180 |
Similar Demographics by Householder Income Ages 45 - 64 years
Demographics Similar to Menominee by Householder Income Ages 45 - 64 years
In terms of householder income ages 45 - 64 years, the demographic groups most similar to Menominee are Cheyenne ($76,362, a difference of 0.71%), Immigrants from Congo ($77,850, a difference of 1.2%), Arapaho ($75,945, a difference of 1.3%), Pueblo ($75,601, a difference of 1.7%), and Hopi ($75,562, a difference of 1.8%).
| Demographics | Rating | Rank | Householder Income Ages 45 - 64 years |
| Seminole | 0.0 /100 | #327 | Tragic $80,077 |
| Natives/Alaskans | 0.0 /100 | #328 | Tragic $79,816 |
| Dutch West Indians | 0.0 /100 | #329 | Tragic $79,171 |
| Creek | 0.0 /100 | #330 | Tragic $78,960 |
| Immigrants | Dominican Republic | 0.0 /100 | #331 | Tragic $78,836 |
| Blacks/African Americans | 0.0 /100 | #332 | Tragic $78,556 |
| Immigrants | Congo | 0.0 /100 | #333 | Tragic $77,850 |
| Menominee | 0.0 /100 | #334 | Tragic $76,903 |
| Cheyenne | 0.0 /100 | #335 | Tragic $76,362 |
| Arapaho | 0.0 /100 | #336 | Tragic $75,945 |
| Pueblo | 0.0 /100 | #337 | Tragic $75,601 |
| Hopi | 0.0 /100 | #338 | Tragic $75,562 |
| Kiowa | 0.0 /100 | #339 | Tragic $74,815 |
| Immigrants | Yemen | 0.0 /100 | #340 | Tragic $74,575 |
| Crow | 0.0 /100 | #341 | Tragic $74,257 |
Demographics Similar to Immigrants from Ethiopia by Householder Income Ages 45 - 64 years
In terms of householder income ages 45 - 64 years, the demographic groups most similar to Immigrants from Ethiopia are Carpatho Rusyn ($102,777, a difference of 0.010%), Costa Rican ($102,779, a difference of 0.020%), Slovene ($102,885, a difference of 0.12%), Slavic ($102,629, a difference of 0.13%), and Scandinavian ($102,969, a difference of 0.20%).
| Demographics | Rating | Rank | Householder Income Ages 45 - 64 years |
| Immigrants | Peru | 80.7 /100 | #150 | Excellent $103,173 |
| Swiss | 79.9 /100 | #151 | Good $103,071 |
| Irish | 79.8 /100 | #152 | Good $103,067 |
| Scandinavians | 79.0 /100 | #153 | Good $102,969 |
| Slovenes | 78.3 /100 | #154 | Good $102,885 |
| Costa Ricans | 77.4 /100 | #155 | Good $102,779 |
| Carpatho Rusyns | 77.4 /100 | #156 | Good $102,777 |
| Immigrants | Ethiopia | 77.3 /100 | #157 | Good $102,763 |
| Slavs | 76.1 /100 | #158 | Good $102,629 |
| Sierra Leoneans | 74.2 /100 | #159 | Good $102,427 |
| Icelanders | 72.5 /100 | #160 | Good $102,261 |
| Immigrants | Nepal | 71.8 /100 | #161 | Good $102,190 |
| Scottish | 71.1 /100 | #162 | Good $102,123 |
| English | 70.1 /100 | #163 | Good $102,021 |
| Immigrants | Morocco | 70.0 /100 | #164 | Good $102,015 |