Menominee vs Seminole Median Family Income
COMPARE
Menominee
Seminole
Median Family Income
Median Family Income Comparison
Menominee
Seminole
$79,563
MEDIAN FAMILY INCOME
0.0/ 100
METRIC RATING
334th/ 347
METRIC RANK
$83,354
MEDIAN FAMILY INCOME
0.0/ 100
METRIC RATING
320th/ 347
METRIC RANK
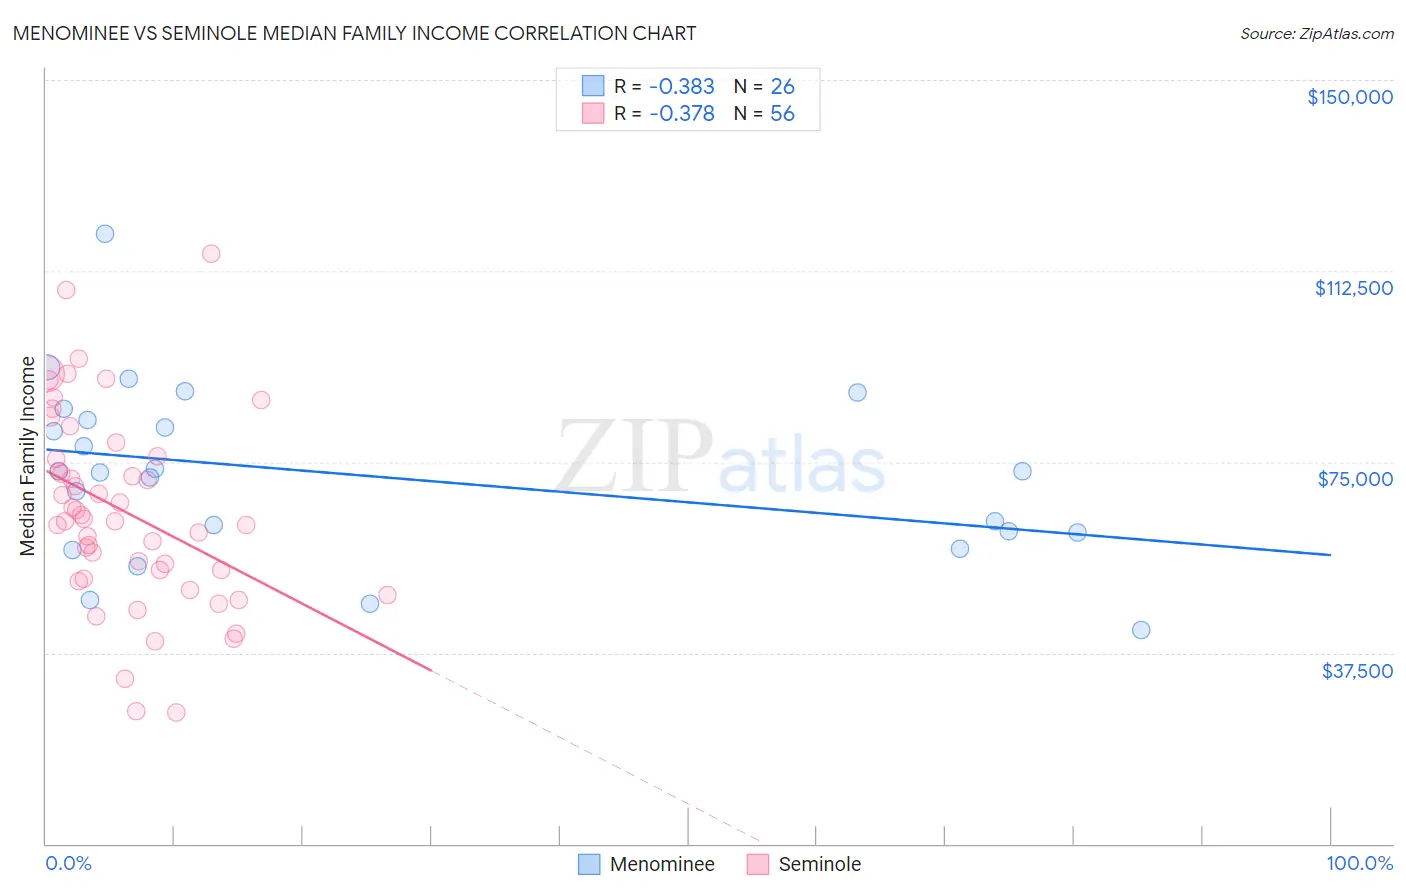
Menominee vs Seminole Median Family Income Correlation Chart
The statistical analysis conducted on geographies consisting of 45,777,534 people shows a mild negative correlation between the proportion of Menominee and median family income in the United States with a correlation coefficient (R) of -0.383 and weighted average of $79,563. Similarly, the statistical analysis conducted on geographies consisting of 118,293,158 people shows a mild negative correlation between the proportion of Seminole and median family income in the United States with a correlation coefficient (R) of -0.378 and weighted average of $83,354, a difference of 4.8%.
Median Family Income Correlation Summary
| Measurement | Menominee | Seminole |
| Minimum | $41,944 | $25,806 |
| Maximum | $119,750 | $115,976 |
| Range | $77,806 | $90,170 |
| Mean | $72,340 | $65,304 |
| Median | $72,940 | $63,647 |
| Interquartile 25% (IQ1) | $61,250 | $52,915 |
| Interquartile 75% (IQ3) | $83,264 | $75,846 |
| Interquartile Range (IQR) | $22,014 | $22,930 |
| Standard Deviation (Sample) | $17,229 | $19,025 |
| Standard Deviation (Population) | $16,895 | $18,855 |
Demographics Similar to Menominee and Seminole by Median Family Income
In terms of median family income, the demographic groups most similar to Menominee are Yup'ik ($79,290, a difference of 0.34%), Kiowa ($80,885, a difference of 1.7%), Immigrants from Cuba ($78,249, a difference of 1.7%), Native/Alaskan ($80,908, a difference of 1.7%), and Yuman ($78,055, a difference of 1.9%). Similarly, the demographic groups most similar to Seminole are Immigrants from Caribbean ($83,319, a difference of 0.040%), Immigrants from Honduras ($83,618, a difference of 0.32%), Immigrants from Mexico ($83,639, a difference of 0.34%), Dominican ($82,888, a difference of 0.56%), and Yakama ($83,932, a difference of 0.69%).
| Demographics | Rating | Rank | Median Family Income |
| Yakama | 0.0 /100 | #317 | Tragic $83,932 |
| Immigrants | Mexico | 0.0 /100 | #318 | Tragic $83,639 |
| Immigrants | Honduras | 0.0 /100 | #319 | Tragic $83,618 |
| Seminole | 0.0 /100 | #320 | Tragic $83,354 |
| Immigrants | Caribbean | 0.0 /100 | #321 | Tragic $83,319 |
| Dominicans | 0.0 /100 | #322 | Tragic $82,888 |
| Bahamians | 0.0 /100 | #323 | Tragic $82,631 |
| Creek | 0.0 /100 | #324 | Tragic $82,560 |
| Sioux | 0.0 /100 | #325 | Tragic $82,386 |
| Immigrants | Congo | 0.0 /100 | #326 | Tragic $82,216 |
| Arapaho | 0.0 /100 | #327 | Tragic $82,064 |
| Blacks/African Americans | 0.0 /100 | #328 | Tragic $81,912 |
| Dutch West Indians | 0.0 /100 | #329 | Tragic $81,852 |
| Cheyenne | 0.0 /100 | #330 | Tragic $81,385 |
| Immigrants | Dominican Republic | 0.0 /100 | #331 | Tragic $81,233 |
| Natives/Alaskans | 0.0 /100 | #332 | Tragic $80,908 |
| Kiowa | 0.0 /100 | #333 | Tragic $80,885 |
| Menominee | 0.0 /100 | #334 | Tragic $79,563 |
| Yup'ik | 0.0 /100 | #335 | Tragic $79,290 |
| Immigrants | Cuba | 0.0 /100 | #336 | Tragic $78,249 |
| Yuman | 0.0 /100 | #337 | Tragic $78,055 |