Maltese vs Asian Median Family Income
COMPARE
Maltese
Asian
Median Family Income
Median Family Income Comparison
Maltese
Asians
$115,862
MEDIAN FAMILY INCOME
99.9/ 100
METRIC RATING
52nd/ 347
METRIC RANK
$119,955
MEDIAN FAMILY INCOME
100.0/ 100
METRIC RATING
32nd/ 347
METRIC RANK
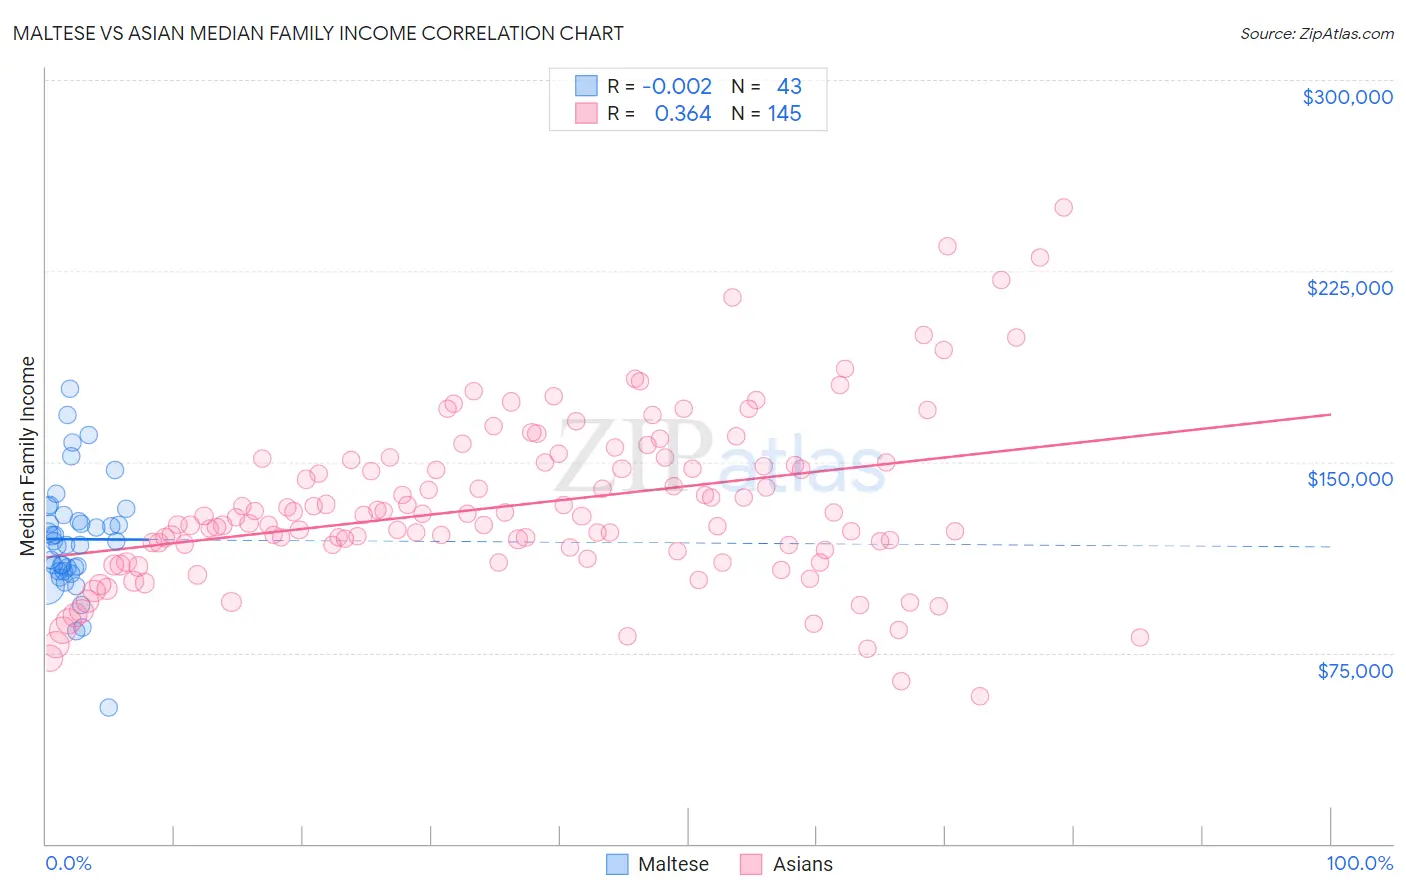
Maltese vs Asian Median Family Income Correlation Chart
The statistical analysis conducted on geographies consisting of 126,250,272 people shows no correlation between the proportion of Maltese and median family income in the United States with a correlation coefficient (R) of -0.002 and weighted average of $115,862. Similarly, the statistical analysis conducted on geographies consisting of 549,758,807 people shows a mild positive correlation between the proportion of Asians and median family income in the United States with a correlation coefficient (R) of 0.364 and weighted average of $119,955, a difference of 3.5%.
Median Family Income Correlation Summary
| Measurement | Maltese | Asian |
| Minimum | $53,672 | $58,163 |
| Maximum | $178,781 | $250,001 |
| Range | $125,109 | $191,838 |
| Mean | $119,621 | $133,077 |
| Median | $118,717 | $128,500 |
| Interquartile 25% (IQ1) | $106,808 | $115,250 |
| Interquartile 75% (IQ3) | $128,909 | $150,323 |
| Interquartile Range (IQR) | $22,102 | $35,073 |
| Standard Deviation (Sample) | $22,839 | $33,384 |
| Standard Deviation (Population) | $22,571 | $33,269 |
Demographics Similar to Maltese and Asians by Median Family Income
In terms of median family income, the demographic groups most similar to Maltese are Immigrants from Malaysia ($115,880, a difference of 0.010%), Immigrants from Czechoslovakia ($116,165, a difference of 0.26%), Chinese ($116,188, a difference of 0.28%), Immigrants from South Africa ($116,286, a difference of 0.37%), and Immigrants from Austria ($116,830, a difference of 0.83%). Similarly, the demographic groups most similar to Asians are Bhutanese ($119,800, a difference of 0.13%), Bolivian ($119,479, a difference of 0.40%), Soviet Union ($119,262, a difference of 0.58%), Israeli ($118,577, a difference of 1.2%), and Australian ($118,440, a difference of 1.3%).
| Demographics | Rating | Rank | Median Family Income |
| Asians | 100.0 /100 | #32 | Exceptional $119,955 |
| Bhutanese | 100.0 /100 | #33 | Exceptional $119,800 |
| Bolivians | 100.0 /100 | #34 | Exceptional $119,479 |
| Soviet Union | 100.0 /100 | #35 | Exceptional $119,262 |
| Israelis | 100.0 /100 | #36 | Exceptional $118,577 |
| Australians | 100.0 /100 | #37 | Exceptional $118,440 |
| Immigrants | Turkey | 100.0 /100 | #38 | Exceptional $118,325 |
| Immigrants | Asia | 100.0 /100 | #39 | Exceptional $118,291 |
| Immigrants | Lithuania | 100.0 /100 | #40 | Exceptional $118,053 |
| Estonians | 100.0 /100 | #41 | Exceptional $118,013 |
| Immigrants | Bolivia | 100.0 /100 | #42 | Exceptional $117,912 |
| Bulgarians | 100.0 /100 | #43 | Exceptional $117,818 |
| Cambodians | 100.0 /100 | #44 | Exceptional $117,780 |
| Immigrants | Greece | 99.9 /100 | #45 | Exceptional $117,344 |
| Immigrants | Russia | 99.9 /100 | #46 | Exceptional $116,942 |
| Immigrants | Austria | 99.9 /100 | #47 | Exceptional $116,830 |
| Immigrants | South Africa | 99.9 /100 | #48 | Exceptional $116,286 |
| Chinese | 99.9 /100 | #49 | Exceptional $116,188 |
| Immigrants | Czechoslovakia | 99.9 /100 | #50 | Exceptional $116,165 |
| Immigrants | Malaysia | 99.9 /100 | #51 | Exceptional $115,880 |
| Maltese | 99.9 /100 | #52 | Exceptional $115,862 |