British West Indian vs Bermudan Median Male Earnings
COMPARE
British West Indian
Bermudan
Median Male Earnings
Median Male Earnings Comparison
British West Indians
Bermudans
$49,636
MEDIAN MALE EARNINGS
0.8/ 100
METRIC RATING
257th/ 347
METRIC RANK
$52,465
MEDIAN MALE EARNINGS
12.1/ 100
METRIC RATING
209th/ 347
METRIC RANK
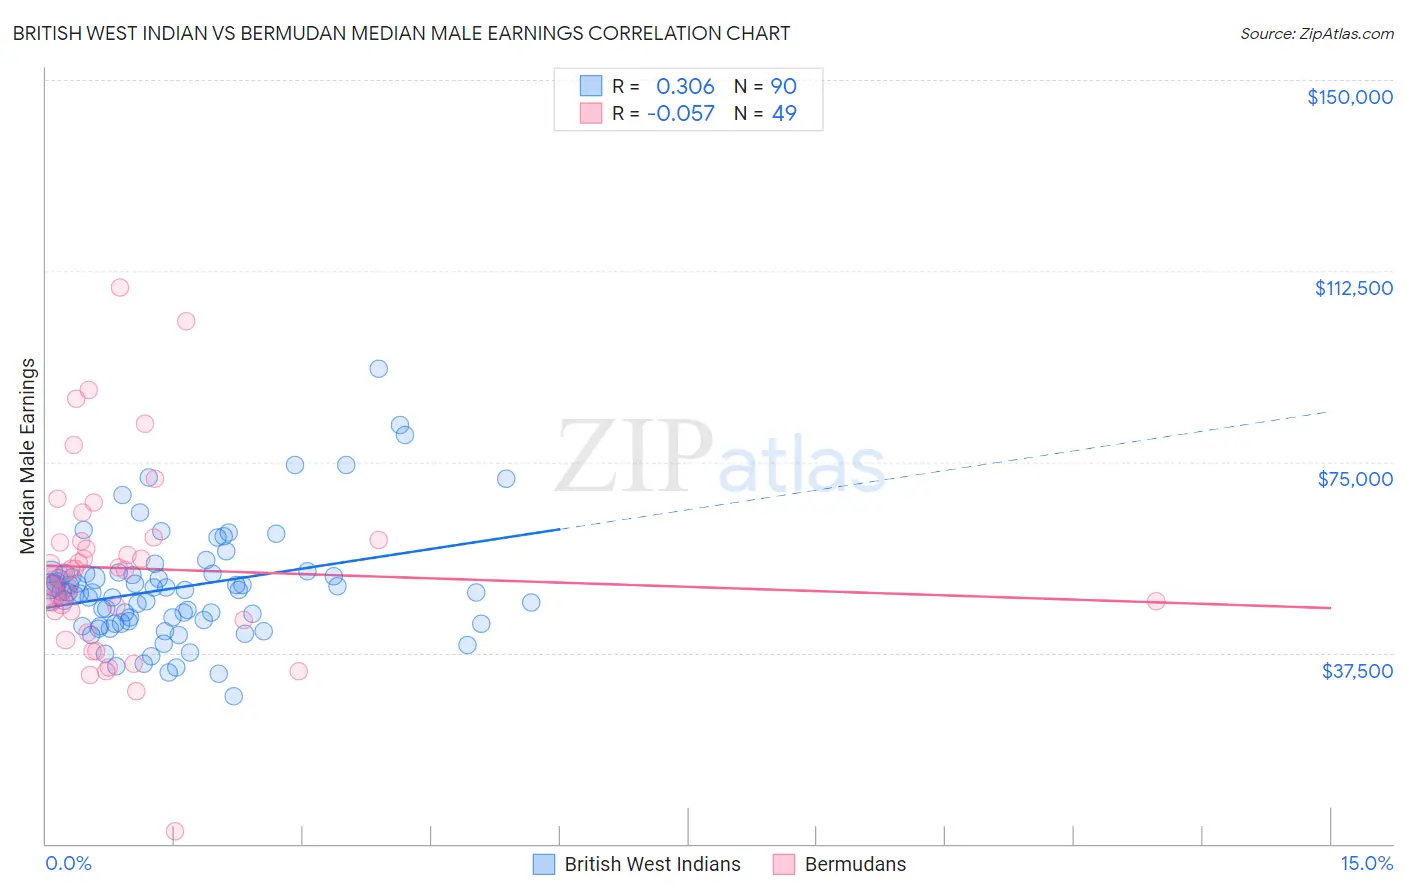
British West Indian vs Bermudan Median Male Earnings Correlation Chart
The statistical analysis conducted on geographies consisting of 152,683,188 people shows a mild positive correlation between the proportion of British West Indians and median male earnings in the United States with a correlation coefficient (R) of 0.306 and weighted average of $49,636. Similarly, the statistical analysis conducted on geographies consisting of 55,727,224 people shows a slight negative correlation between the proportion of Bermudans and median male earnings in the United States with a correlation coefficient (R) of -0.057 and weighted average of $52,465, a difference of 5.7%.
Median Male Earnings Correlation Summary
| Measurement | British West Indian | Bermudan |
| Minimum | $28,979 | $2,499 |
| Maximum | $93,333 | $109,250 |
| Range | $64,354 | $106,751 |
| Mean | $50,358 | $54,094 |
| Median | $49,413 | $53,290 |
| Interquartile 25% (IQ1) | $43,337 | $44,820 |
| Interquartile 75% (IQ3) | $53,079 | $59,519 |
| Interquartile Range (IQR) | $9,742 | $14,700 |
| Standard Deviation (Sample) | $11,060 | $18,662 |
| Standard Deviation (Population) | $10,999 | $18,471 |
Similar Demographics by Median Male Earnings
Demographics Similar to British West Indians by Median Male Earnings
In terms of median male earnings, the demographic groups most similar to British West Indians are Alaska Native ($49,711, a difference of 0.15%), Alaskan Athabascan ($49,748, a difference of 0.23%), Senegalese ($49,774, a difference of 0.28%), Cree ($49,497, a difference of 0.28%), and Nepalese ($49,458, a difference of 0.36%).
| Demographics | Rating | Rank | Median Male Earnings |
| Osage | 1.6 /100 | #250 | Tragic $50,292 |
| Immigrants | Grenada | 1.6 /100 | #251 | Tragic $50,279 |
| Immigrants | Cabo Verde | 1.2 /100 | #252 | Tragic $50,009 |
| German Russians | 1.1 /100 | #253 | Tragic $49,924 |
| Senegalese | 1.0 /100 | #254 | Tragic $49,774 |
| Alaskan Athabascans | 0.9 /100 | #255 | Tragic $49,748 |
| Alaska Natives | 0.9 /100 | #256 | Tragic $49,711 |
| British West Indians | 0.8 /100 | #257 | Tragic $49,636 |
| Cree | 0.7 /100 | #258 | Tragic $49,497 |
| Nepalese | 0.7 /100 | #259 | Tragic $49,458 |
| Iroquois | 0.7 /100 | #260 | Tragic $49,374 |
| Liberians | 0.6 /100 | #261 | Tragic $49,318 |
| Immigrants | West Indies | 0.6 /100 | #262 | Tragic $49,271 |
| Nicaraguans | 0.6 /100 | #263 | Tragic $49,215 |
| Immigrants | Middle Africa | 0.6 /100 | #264 | Tragic $49,201 |
Demographics Similar to Bermudans by Median Male Earnings
In terms of median male earnings, the demographic groups most similar to Bermudans are Venezuelan ($52,510, a difference of 0.090%), Delaware ($52,412, a difference of 0.10%), Vietnamese ($52,525, a difference of 0.11%), Tlingit-Haida ($52,409, a difference of 0.11%), and Cajun ($52,325, a difference of 0.27%).
| Demographics | Rating | Rank | Median Male Earnings |
| Immigrants | Uruguay | 16.8 /100 | #202 | Poor $52,860 |
| Panamanians | 16.5 /100 | #203 | Poor $52,835 |
| Ghanaians | 16.1 /100 | #204 | Poor $52,810 |
| Immigrants | Colombia | 15.0 /100 | #205 | Poor $52,725 |
| Immigrants | Iraq | 14.5 /100 | #206 | Poor $52,681 |
| Vietnamese | 12.7 /100 | #207 | Poor $52,525 |
| Venezuelans | 12.5 /100 | #208 | Poor $52,510 |
| Bermudans | 12.1 /100 | #209 | Poor $52,465 |
| Delaware | 11.5 /100 | #210 | Poor $52,412 |
| Tlingit-Haida | 11.5 /100 | #211 | Poor $52,409 |
| Cajuns | 10.7 /100 | #212 | Poor $52,325 |
| Native Hawaiians | 10.5 /100 | #213 | Poor $52,306 |
| Immigrants | Nonimmigrants | 9.3 /100 | #214 | Tragic $52,170 |
| Immigrants | Cameroon | 8.9 /100 | #215 | Tragic $52,119 |
| Immigrants | Venezuela | 8.3 /100 | #216 | Tragic $52,041 |