Immigrants from China vs Irish Median Male Earnings
COMPARE
Immigrants from China
Irish
Median Male Earnings
Median Male Earnings Comparison
Immigrants from China
Irish
$67,353
MEDIAN MALE EARNINGS
100.0/ 100
METRIC RATING
13th/ 347
METRIC RANK
$56,464
MEDIAN MALE EARNINGS
87.4/ 100
METRIC RATING
135th/ 347
METRIC RANK
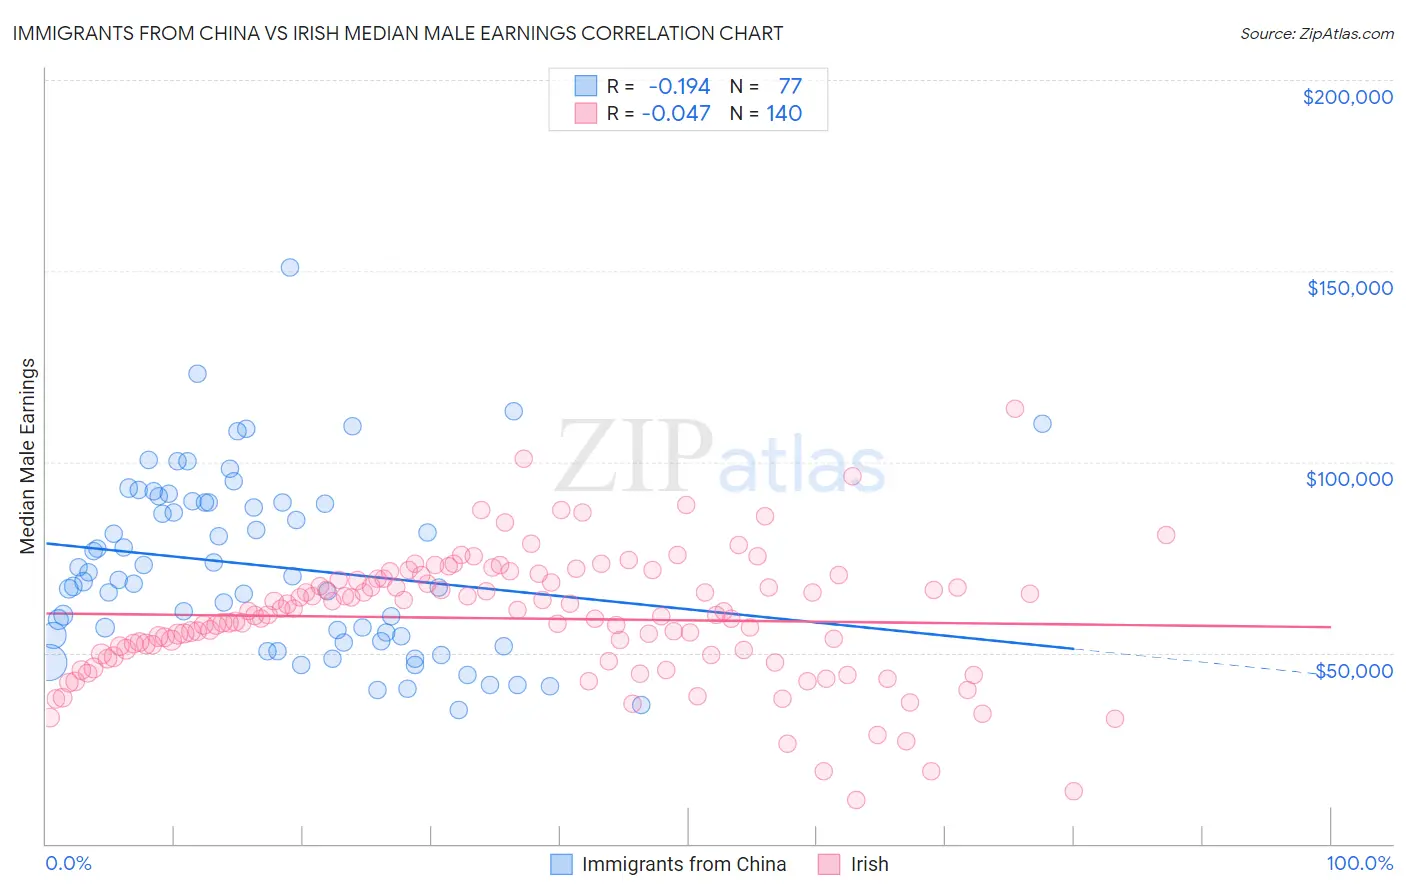
Immigrants from China vs Irish Median Male Earnings Correlation Chart
The statistical analysis conducted on geographies consisting of 456,906,248 people shows a poor negative correlation between the proportion of Immigrants from China and median male earnings in the United States with a correlation coefficient (R) of -0.194 and weighted average of $67,353. Similarly, the statistical analysis conducted on geographies consisting of 578,544,263 people shows no correlation between the proportion of Irish and median male earnings in the United States with a correlation coefficient (R) of -0.047 and weighted average of $56,464, a difference of 19.3%.
Median Male Earnings Correlation Summary
| Measurement | Immigrants from China | Irish |
| Minimum | $35,000 | $11,458 |
| Maximum | $150,740 | $113,788 |
| Range | $115,740 | $102,330 |
| Mean | $72,671 | $59,014 |
| Median | $69,216 | $59,889 |
| Interquartile 25% (IQ1) | $53,825 | $49,565 |
| Interquartile 75% (IQ3) | $89,334 | $68,949 |
| Interquartile Range (IQR) | $35,509 | $19,384 |
| Standard Deviation (Sample) | $23,135 | $16,409 |
| Standard Deviation (Population) | $22,985 | $16,350 |
Similar Demographics by Median Male Earnings
Demographics Similar to Immigrants from China by Median Male Earnings
In terms of median male earnings, the demographic groups most similar to Immigrants from China are Okinawan ($67,232, a difference of 0.18%), Immigrants from Australia ($67,634, a difference of 0.42%), Immigrants from Ireland ($67,698, a difference of 0.51%), Immigrants from Eastern Asia ($66,903, a difference of 0.67%), and Eastern European ($66,472, a difference of 1.3%).
| Demographics | Rating | Rank | Median Male Earnings |
| Iranians | 100.0 /100 | #6 | Exceptional $70,648 |
| Immigrants | Hong Kong | 100.0 /100 | #7 | Exceptional $70,146 |
| Immigrants | Iran | 100.0 /100 | #8 | Exceptional $69,284 |
| Immigrants | South Central Asia | 100.0 /100 | #9 | Exceptional $68,960 |
| Immigrants | Israel | 100.0 /100 | #10 | Exceptional $68,716 |
| Immigrants | Ireland | 100.0 /100 | #11 | Exceptional $67,698 |
| Immigrants | Australia | 100.0 /100 | #12 | Exceptional $67,634 |
| Immigrants | China | 100.0 /100 | #13 | Exceptional $67,353 |
| Okinawans | 100.0 /100 | #14 | Exceptional $67,232 |
| Immigrants | Eastern Asia | 100.0 /100 | #15 | Exceptional $66,903 |
| Eastern Europeans | 100.0 /100 | #16 | Exceptional $66,472 |
| Immigrants | Belgium | 100.0 /100 | #17 | Exceptional $66,125 |
| Indians (Asian) | 100.0 /100 | #18 | Exceptional $66,078 |
| Cypriots | 100.0 /100 | #19 | Exceptional $65,549 |
| Immigrants | Japan | 100.0 /100 | #20 | Exceptional $65,518 |
Demographics Similar to Irish by Median Male Earnings
In terms of median male earnings, the demographic groups most similar to Irish are Immigrants from Saudi Arabia ($56,452, a difference of 0.020%), Moroccan ($56,499, a difference of 0.060%), Slavic ($56,390, a difference of 0.13%), Czech ($56,546, a difference of 0.14%), and Immigrants from Germany ($56,542, a difference of 0.14%).
| Demographics | Rating | Rank | Median Male Earnings |
| Immigrants | Syria | 90.8 /100 | #128 | Exceptional $56,830 |
| Pakistanis | 89.9 /100 | #129 | Excellent $56,719 |
| Koreans | 89.4 /100 | #130 | Excellent $56,672 |
| Portuguese | 89.4 /100 | #131 | Excellent $56,663 |
| Czechs | 88.2 /100 | #132 | Excellent $56,546 |
| Immigrants | Germany | 88.2 /100 | #133 | Excellent $56,542 |
| Moroccans | 87.7 /100 | #134 | Excellent $56,499 |
| Irish | 87.4 /100 | #135 | Excellent $56,464 |
| Immigrants | Saudi Arabia | 87.2 /100 | #136 | Excellent $56,452 |
| Slavs | 86.5 /100 | #137 | Excellent $56,390 |
| Slovaks | 85.5 /100 | #138 | Excellent $56,306 |
| Zimbabweans | 85.5 /100 | #139 | Excellent $56,302 |
| Luxembourgers | 85.5 /100 | #140 | Excellent $56,300 |
| Danes | 84.8 /100 | #141 | Excellent $56,246 |
| Ethiopians | 84.8 /100 | #142 | Excellent $56,243 |