Immigrants from Croatia vs Irish Median Male Earnings
COMPARE
Immigrants from Croatia
Irish
Median Male Earnings
Median Male Earnings Comparison
Immigrants from Croatia
Irish
$60,914
MEDIAN MALE EARNINGS
99.8/ 100
METRIC RATING
66th/ 347
METRIC RANK
$56,464
MEDIAN MALE EARNINGS
87.4/ 100
METRIC RATING
135th/ 347
METRIC RANK
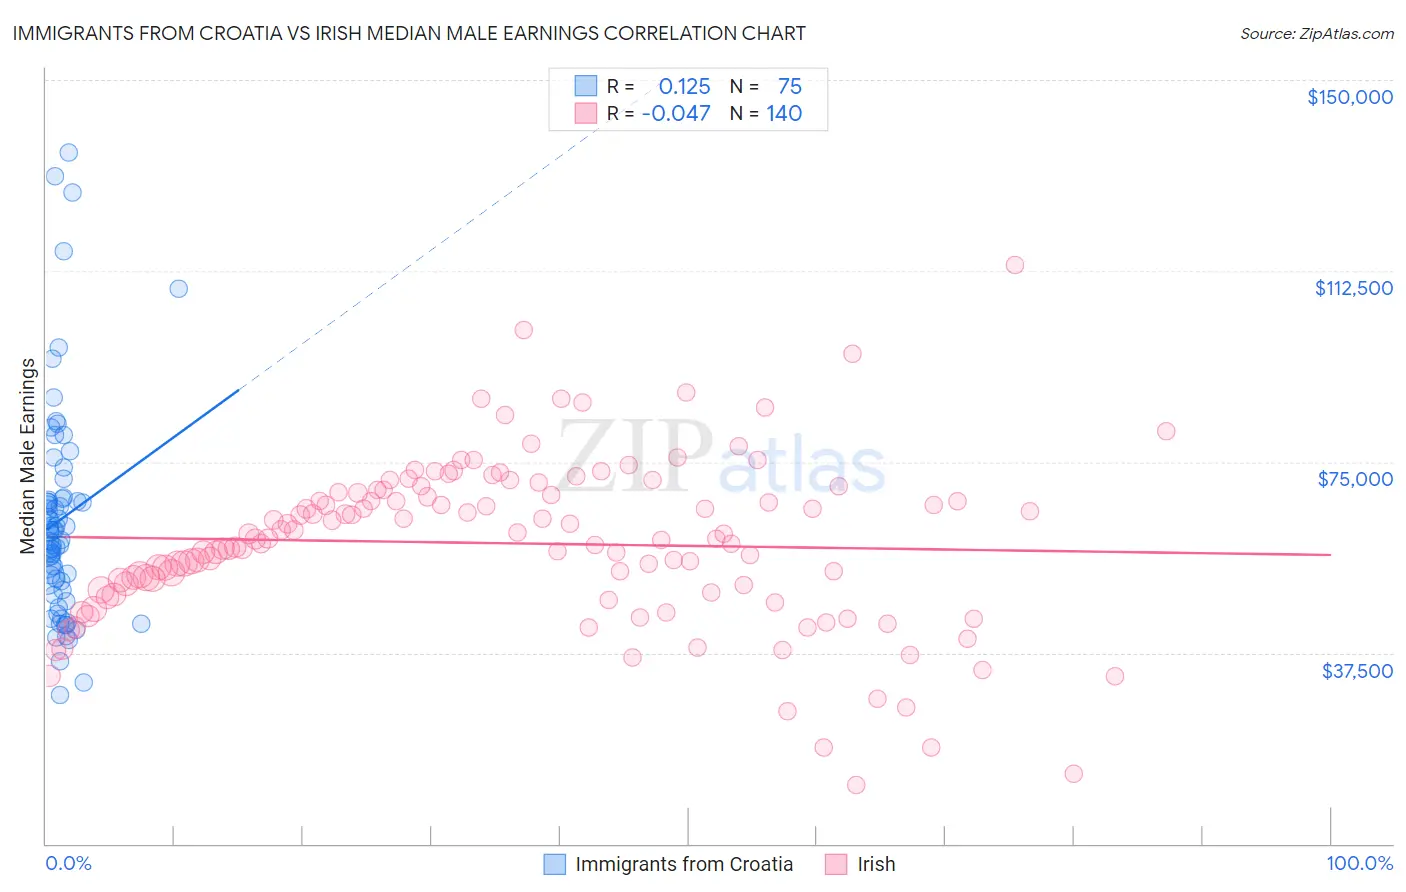
Immigrants from Croatia vs Irish Median Male Earnings Correlation Chart
The statistical analysis conducted on geographies consisting of 132,568,017 people shows a poor positive correlation between the proportion of Immigrants from Croatia and median male earnings in the United States with a correlation coefficient (R) of 0.125 and weighted average of $60,914. Similarly, the statistical analysis conducted on geographies consisting of 578,544,263 people shows no correlation between the proportion of Irish and median male earnings in the United States with a correlation coefficient (R) of -0.047 and weighted average of $56,464, a difference of 7.9%.
Median Male Earnings Correlation Summary
| Measurement | Immigrants from Croatia | Irish |
| Minimum | $29,220 | $11,458 |
| Maximum | $135,716 | $113,788 |
| Range | $106,496 | $102,330 |
| Mean | $63,717 | $59,014 |
| Median | $61,084 | $59,889 |
| Interquartile 25% (IQ1) | $49,929 | $49,565 |
| Interquartile 75% (IQ3) | $67,721 | $68,949 |
| Interquartile Range (IQR) | $17,792 | $19,384 |
| Standard Deviation (Sample) | $21,463 | $16,409 |
| Standard Deviation (Population) | $21,320 | $16,350 |
Similar Demographics by Median Male Earnings
Demographics Similar to Immigrants from Croatia by Median Male Earnings
In terms of median male earnings, the demographic groups most similar to Immigrants from Croatia are Immigrants from Indonesia ($60,935, a difference of 0.030%), Immigrants from Eastern Europe ($60,958, a difference of 0.070%), Immigrants from Pakistan ($60,987, a difference of 0.12%), Immigrants from Romania ($61,040, a difference of 0.21%), and Bolivian ($61,066, a difference of 0.25%).
| Demographics | Rating | Rank | Median Male Earnings |
| Immigrants | Netherlands | 99.8 /100 | #59 | Exceptional $61,096 |
| Egyptians | 99.8 /100 | #60 | Exceptional $61,095 |
| Bolivians | 99.8 /100 | #61 | Exceptional $61,066 |
| Immigrants | Romania | 99.8 /100 | #62 | Exceptional $61,040 |
| Immigrants | Pakistan | 99.8 /100 | #63 | Exceptional $60,987 |
| Immigrants | Eastern Europe | 99.8 /100 | #64 | Exceptional $60,958 |
| Immigrants | Indonesia | 99.8 /100 | #65 | Exceptional $60,935 |
| Immigrants | Croatia | 99.8 /100 | #66 | Exceptional $60,914 |
| Immigrants | Spain | 99.8 /100 | #67 | Exceptional $60,750 |
| Immigrants | Serbia | 99.7 /100 | #68 | Exceptional $60,600 |
| Immigrants | Canada | 99.7 /100 | #69 | Exceptional $60,388 |
| Immigrants | Bulgaria | 99.7 /100 | #70 | Exceptional $60,358 |
| Mongolians | 99.7 /100 | #71 | Exceptional $60,350 |
| Immigrants | Western Europe | 99.7 /100 | #72 | Exceptional $60,334 |
| Immigrants | North America | 99.7 /100 | #73 | Exceptional $60,265 |
Demographics Similar to Irish by Median Male Earnings
In terms of median male earnings, the demographic groups most similar to Irish are Immigrants from Saudi Arabia ($56,452, a difference of 0.020%), Moroccan ($56,499, a difference of 0.060%), Slavic ($56,390, a difference of 0.13%), Czech ($56,546, a difference of 0.14%), and Immigrants from Germany ($56,542, a difference of 0.14%).
| Demographics | Rating | Rank | Median Male Earnings |
| Immigrants | Syria | 90.8 /100 | #128 | Exceptional $56,830 |
| Pakistanis | 89.9 /100 | #129 | Excellent $56,719 |
| Koreans | 89.4 /100 | #130 | Excellent $56,672 |
| Portuguese | 89.4 /100 | #131 | Excellent $56,663 |
| Czechs | 88.2 /100 | #132 | Excellent $56,546 |
| Immigrants | Germany | 88.2 /100 | #133 | Excellent $56,542 |
| Moroccans | 87.7 /100 | #134 | Excellent $56,499 |
| Irish | 87.4 /100 | #135 | Excellent $56,464 |
| Immigrants | Saudi Arabia | 87.2 /100 | #136 | Excellent $56,452 |
| Slavs | 86.5 /100 | #137 | Excellent $56,390 |
| Slovaks | 85.5 /100 | #138 | Excellent $56,306 |
| Zimbabweans | 85.5 /100 | #139 | Excellent $56,302 |
| Luxembourgers | 85.5 /100 | #140 | Excellent $56,300 |
| Danes | 84.8 /100 | #141 | Excellent $56,246 |
| Ethiopians | 84.8 /100 | #142 | Excellent $56,243 |