Malaysian vs Serbian Median Family Income
COMPARE
Malaysian
Serbian
Median Family Income
Median Family Income Comparison
Malaysians
Serbians
$95,230
MEDIAN FAMILY INCOME
2.2/ 100
METRIC RATING
230th/ 347
METRIC RANK
$107,157
MEDIAN FAMILY INCOME
90.8/ 100
METRIC RATING
126th/ 347
METRIC RANK
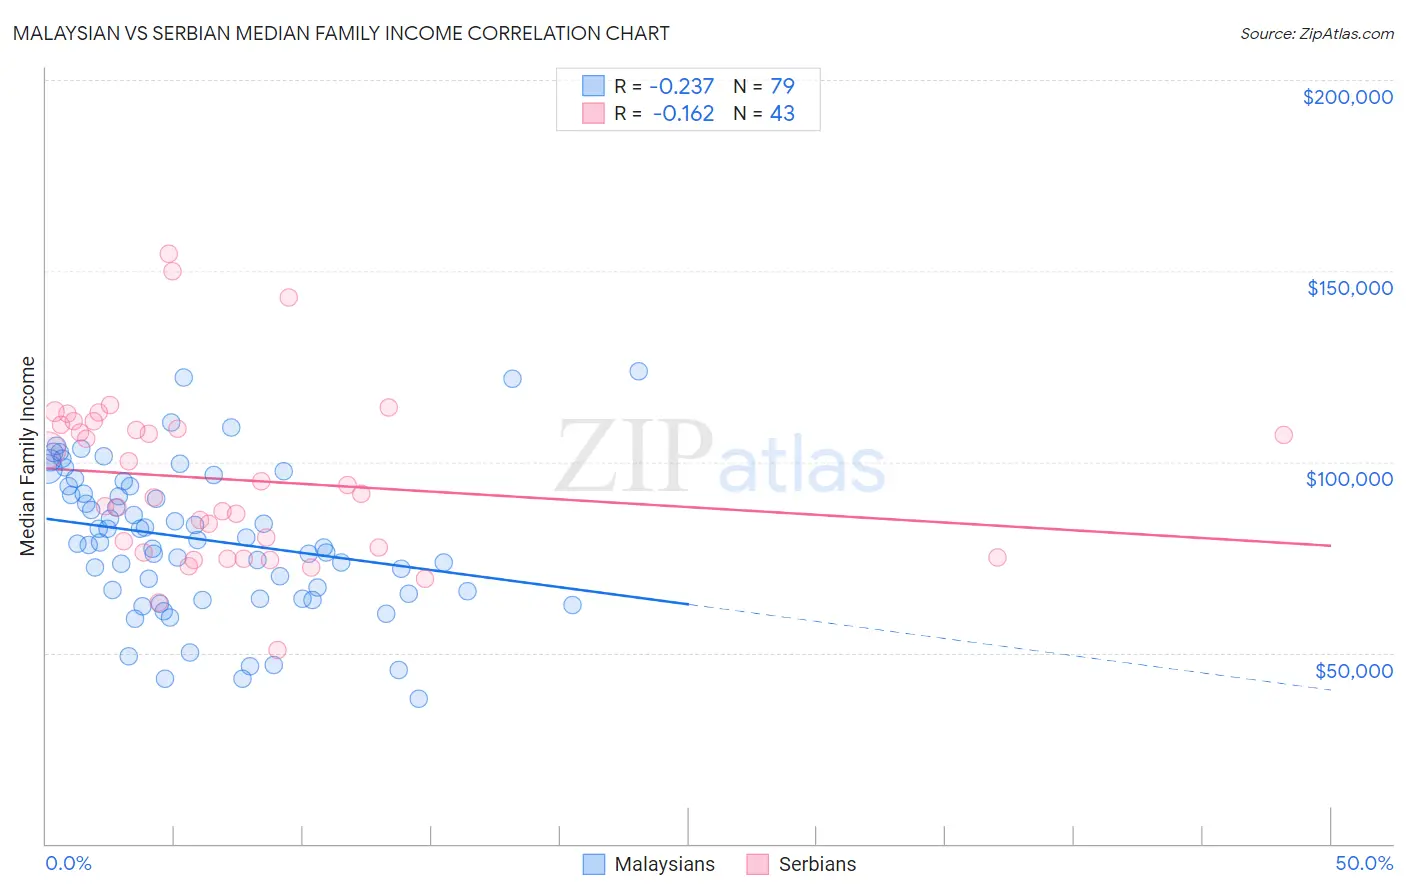
Malaysian vs Serbian Median Family Income Correlation Chart
The statistical analysis conducted on geographies consisting of 225,953,352 people shows a weak negative correlation between the proportion of Malaysians and median family income in the United States with a correlation coefficient (R) of -0.237 and weighted average of $95,230. Similarly, the statistical analysis conducted on geographies consisting of 267,482,647 people shows a poor negative correlation between the proportion of Serbians and median family income in the United States with a correlation coefficient (R) of -0.162 and weighted average of $107,157, a difference of 12.5%.
Median Family Income Correlation Summary
| Measurement | Malaysian | Serbian |
| Minimum | $38,021 | $50,679 |
| Maximum | $123,750 | $154,464 |
| Range | $85,729 | $103,785 |
| Mean | $79,701 | $95,313 |
| Median | $78,842 | $91,648 |
| Interquartile 25% (IQ1) | $65,625 | $76,245 |
| Interquartile 75% (IQ3) | $93,739 | $109,780 |
| Interquartile Range (IQR) | $28,114 | $33,535 |
| Standard Deviation (Sample) | $19,147 | $22,166 |
| Standard Deviation (Population) | $19,025 | $21,907 |
Similar Demographics by Median Family Income
Demographics Similar to Malaysians by Median Family Income
In terms of median family income, the demographic groups most similar to Malaysians are Marshallese ($95,293, a difference of 0.070%), Ecuadorian ($95,114, a difference of 0.12%), Immigrants from the Azores ($95,402, a difference of 0.18%), Immigrants from Venezuela ($94,904, a difference of 0.34%), and Alaska Native ($95,573, a difference of 0.36%).
| Demographics | Rating | Rank | Median Family Income |
| Venezuelans | 3.7 /100 | #223 | Tragic $96,281 |
| Immigrants | Nonimmigrants | 3.6 /100 | #224 | Tragic $96,231 |
| Vietnamese | 3.4 /100 | #225 | Tragic $96,123 |
| Immigrants | Panama | 2.7 /100 | #226 | Tragic $95,647 |
| Alaska Natives | 2.6 /100 | #227 | Tragic $95,573 |
| Immigrants | Azores | 2.4 /100 | #228 | Tragic $95,402 |
| Marshallese | 2.2 /100 | #229 | Tragic $95,293 |
| Malaysians | 2.2 /100 | #230 | Tragic $95,230 |
| Ecuadorians | 2.1 /100 | #231 | Tragic $95,114 |
| Immigrants | Venezuela | 1.9 /100 | #232 | Tragic $94,904 |
| Immigrants | Bangladesh | 1.6 /100 | #233 | Tragic $94,665 |
| Immigrants | Western Africa | 1.6 /100 | #234 | Tragic $94,638 |
| Immigrants | Burma/Myanmar | 1.5 /100 | #235 | Tragic $94,472 |
| Trinidadians and Tobagonians | 1.5 /100 | #236 | Tragic $94,466 |
| Alaskan Athabascans | 1.5 /100 | #237 | Tragic $94,429 |
Demographics Similar to Serbians by Median Family Income
In terms of median family income, the demographic groups most similar to Serbians are Lebanese ($107,086, a difference of 0.070%), Taiwanese ($107,295, a difference of 0.13%), Immigrants from Ethiopia ($106,969, a difference of 0.18%), Arab ($106,952, a difference of 0.19%), and Brazilian ($106,942, a difference of 0.20%).
| Demographics | Rating | Rank | Median Family Income |
| Sri Lankans | 94.5 /100 | #119 | Exceptional $108,234 |
| Immigrants | Northern Africa | 94.3 /100 | #120 | Exceptional $108,161 |
| Europeans | 94.1 /100 | #121 | Exceptional $108,099 |
| Immigrants | Jordan | 92.9 /100 | #122 | Exceptional $107,715 |
| Carpatho Rusyns | 92.2 /100 | #123 | Exceptional $107,502 |
| Pakistanis | 91.7 /100 | #124 | Exceptional $107,390 |
| Taiwanese | 91.4 /100 | #125 | Exceptional $107,295 |
| Serbians | 90.8 /100 | #126 | Exceptional $107,157 |
| Lebanese | 90.5 /100 | #127 | Exceptional $107,086 |
| Immigrants | Ethiopia | 90.0 /100 | #128 | Excellent $106,969 |
| Arabs | 89.9 /100 | #129 | Excellent $106,952 |
| Brazilians | 89.8 /100 | #130 | Excellent $106,942 |
| Canadians | 88.1 /100 | #131 | Excellent $106,597 |
| Immigrants | Fiji | 87.8 /100 | #132 | Excellent $106,544 |
| Ugandans | 87.8 /100 | #133 | Excellent $106,541 |