Malaysian vs Sierra Leonean Median Family Income

COMPARE

Malaysian
Race
Ancestry
AfghanAfricanAlaska NativeAlaskan AthabascanAlbanianAleutAlsatianAmericanApacheArabArapahoArgentineanArmenianAssyrian/Chaldean/SyriacAustralianAustrianBahamianBangladeshiBarbadianBasqueBelgianBelizeanBermudanBhutaneseBlackfeetBolivianBrazilianBritishBritish West IndianBulgarianBurmeseCajunCambodianCanadianCape VerdeanCarpatho RusynCelticCentral AmericanCentral American IndianCherokeeCheyenneChickasawChileanChineseChippewaChoctawColombianColvilleComancheCosta RicanCreeCreekCroatianCrowCubanCypriotCzechCzechoslovakianDanishDelawareDominicanDutchDutch West IndianEastern EuropeanEcuadorianEgyptianEnglishEstonianEthiopianEuropeanFijianFilipinoFinnishFrenchFrench American IndianFrench CanadianGermanGerman RussianGhanaianGreekGuamanian/ChamorroGuatemalanGuyaneseHaitianHmongHonduranHopiHoumaHungarianIcelanderIndian (Asian)IndonesianInupiatIranianIraqiIrishIroquoisIsraeliItalianJamaicanJapaneseJordanianKenyanKiowaKoreanLaotianLatvianLebaneseLiberianLithuanianLumbeeLuxembourgerMacedonianMalaysianMalteseMarshalleseMenomineeMexicanMexican American IndianMongolianMoroccanNative HawaiianNavajoNepaleseNew ZealanderNicaraguanNigerianNorthern EuropeanNorwegianOkinawanOsageOttawaPaiutePakistaniPalestinianPanamanianParaguayanPennsylvania GermanPeruvianPimaPolishPortuguesePotawatomiPuebloPuerto RicanPuget Sound SalishRomanianRussianSalvadoranSamoanScandinavianScotch-IrishScottishSeminoleSenegaleseSerbianShoshoneSiouxSlavicSlovakSloveneSomaliSouth AfricanSouth AmericanSouth American IndianSoviet UnionSpaniardSpanishSpanish AmericanSpanish American IndianSri LankanSubsaharan AfricanSudaneseSwedishSwissSyrianTaiwaneseThaiTlingit-HaidaTohono O'OdhamTonganTrinidadian and TobagonianTsimshianTurkishU.S. Virgin IslanderUgandanUkrainianUruguayanUteVenezuelanVietnameseWelshWest IndianYakamaYaquiYugoslavianYumanYup'ikZimbabwean
Immigration
NonimmigrantsImmigrantsAfghanistanAfricaAlbaniaArgentinaArmeniaAsiaAustraliaAustriaBahamasBangladeshBarbadosBelarusBelgiumBelizeBoliviaBosnia and HerzegovinaBrazilBulgariaBurma/MyanmarCabo VerdeCambodiaCameroonCanadaCaribbeanCentral AmericaChileChinaColombiaCongoCosta RicaCroatiaCubaCzechoslovakiaDenmarkDominicaDominican RepublicEastern AfricaEastern AsiaEastern EuropeEcuadorEgyptEl SalvadorEnglandEritreaEthiopiaEuropeFijiFranceGermanyGhanaGreeceGrenadaGuatemalaGuyanaHaitiHondurasHong KongHungaryIndiaIndonesiaIranIraqIrelandIsraelItalyJamaicaJapanJordanKazakhstanKenyaKoreaKuwaitLaosLatin AmericaLatviaLebanonLiberiaLithuaniaMalaysiaMexicoMicronesiaMiddle AfricaMoldovaMoroccoNepalNetherlandsNicaraguaNigeriaNorth AmericaNorth MacedoniaNorthern AfricaNorthern EuropeNorwayOceaniaPakistanPanamaPeruPhilippinesPolandPortugalRomaniaRussiaSaudi ArabiaScotlandSenegalSerbiaSierra LeoneSingaporeSomaliaSouth AfricaSouth AmericaSouth Central AsiaSouth Eastern AsiaSouthern EuropeSpainSri LankaSt. Vincent and the GrenadinesSudanSwedenSwitzerlandSyriaTaiwanThailandTrinidad and TobagoTurkeyUgandaUkraineUruguayUzbekistanVenezuelaVietnamWest IndiesWestern AfricaWestern AsiaWestern EuropeYemenZaireZimbabweAzores
Sierra Leonean
Race
Ancestry
AfghanAfricanAlaska NativeAlaskan AthabascanAlbanianAleutAlsatianAmericanApacheArabArapahoArgentineanArmenianAssyrian/Chaldean/SyriacAustralianAustrianBahamianBangladeshiBarbadianBasqueBelgianBelizeanBermudanBhutaneseBlackfeetBolivianBrazilianBritishBritish West IndianBulgarianBurmeseCajunCambodianCanadianCape VerdeanCarpatho RusynCelticCentral AmericanCentral American IndianCherokeeCheyenneChickasawChileanChineseChippewaChoctawColombianColvilleComancheCosta RicanCreeCreekCroatianCrowCubanCypriotCzechCzechoslovakianDanishDelawareDominicanDutchDutch West IndianEastern EuropeanEcuadorianEgyptianEnglishEstonianEthiopianEuropeanFijianFilipinoFinnishFrenchFrench American IndianFrench CanadianGermanGerman RussianGhanaianGreekGuamanian/ChamorroGuatemalanGuyaneseHaitianHmongHonduranHopiHoumaHungarianIcelanderIndian (Asian)IndonesianInupiatIranianIraqiIrishIroquoisIsraeliItalianJamaicanJapaneseJordanianKenyanKiowaKoreanLaotianLatvianLebaneseLiberianLithuanianLumbeeLuxembourgerMacedonianMalteseMarshalleseMenomineeMexicanMexican American IndianMongolianMoroccanNative HawaiianNavajoNepaleseNew ZealanderNicaraguanNigerianNorthern EuropeanNorwegianOkinawanOsageOttawaPaiutePakistaniPalestinianPanamanianParaguayanPennsylvania GermanPeruvianPimaPolishPortuguesePotawatomiPuebloPuerto RicanPuget Sound SalishRomanianRussianSalvadoranSamoanScandinavianScotch-IrishScottishSeminoleSenegaleseSerbianShoshoneSierra LeoneanSiouxSlavicSlovakSloveneSomaliSouth AfricanSouth AmericanSouth American IndianSoviet UnionSpaniardSpanishSpanish AmericanSpanish American IndianSri LankanSubsaharan AfricanSudaneseSwedishSwissSyrianTaiwaneseThaiTlingit-HaidaTohono O'OdhamTonganTrinidadian and TobagonianTsimshianTurkishU.S. Virgin IslanderUgandanUkrainianUruguayanUteVenezuelanVietnameseWelshWest IndianYakamaYaquiYugoslavianYumanYup'ikZimbabwean
Immigration
NonimmigrantsImmigrantsAfghanistanAfricaAlbaniaArgentinaArmeniaAsiaAustraliaAustriaBahamasBangladeshBarbadosBelarusBelgiumBelizeBoliviaBosnia and HerzegovinaBrazilBulgariaBurma/MyanmarCabo VerdeCambodiaCameroonCanadaCaribbeanCentral AmericaChileChinaColombiaCongoCosta RicaCroatiaCubaCzechoslovakiaDenmarkDominicaDominican RepublicEastern AfricaEastern AsiaEastern EuropeEcuadorEgyptEl SalvadorEnglandEritreaEthiopiaEuropeFijiFranceGermanyGhanaGreeceGrenadaGuatemalaGuyanaHaitiHondurasHong KongHungaryIndiaIndonesiaIranIraqIrelandIsraelItalyJamaicaJapanJordanKazakhstanKenyaKoreaKuwaitLaosLatin AmericaLatviaLebanonLiberiaLithuaniaMalaysiaMexicoMicronesiaMiddle AfricaMoldovaMoroccoNepalNetherlandsNicaraguaNigeriaNorth AmericaNorth MacedoniaNorthern AfricaNorthern EuropeNorwayOceaniaPakistanPanamaPeruPhilippinesPolandPortugalRomaniaRussiaSaudi ArabiaScotlandSenegalSerbiaSierra LeoneSingaporeSomaliaSouth AfricaSouth AmericaSouth Central AsiaSouth Eastern AsiaSouthern EuropeSpainSri LankaSt. Vincent and the GrenadinesSudanSwedenSwitzerlandSyriaTaiwanThailandTrinidad and TobagoTurkeyUgandaUkraineUruguayUzbekistanVenezuelaVietnamWest IndiesWestern AfricaWestern AsiaWestern EuropeYemenZaireZimbabweAzores
Median Family Income
Income
Poverty
Unemployment
Labor Participation
Family Structure
Vehicle Availability
Education Level
Disability

Median Family Income Comparison

Malaysians

Sierra Leoneans

Tragic
Good
$95,230
MEDIAN FAMILY INCOME
2.2/ 100
METRIC RATING
230th/ 347
METRIC RANK
$103,859
MEDIAN FAMILY INCOME
64.7/ 100
METRIC RATING
164th/ 347
METRIC RANK

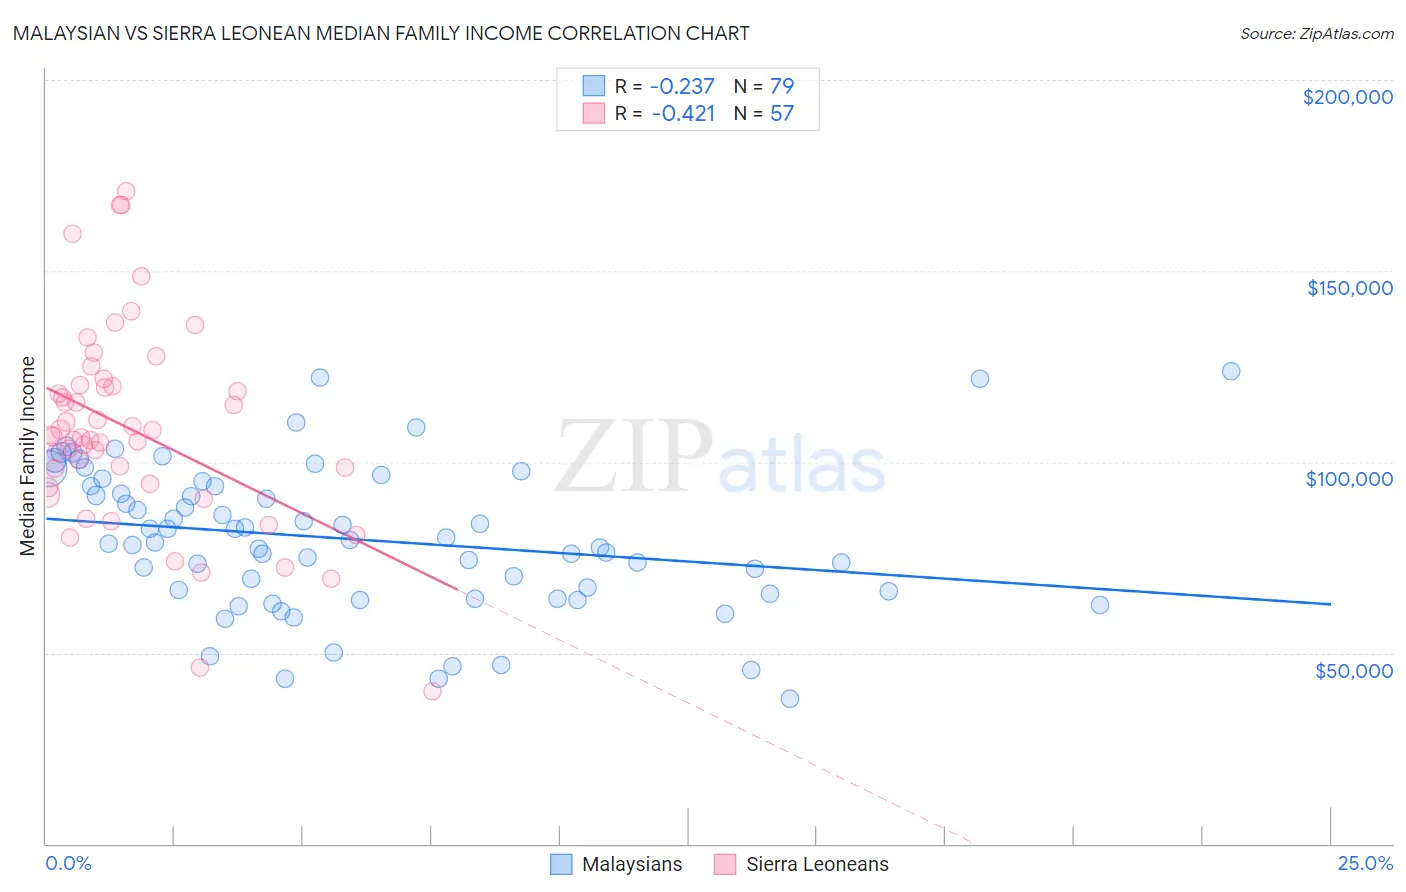
Malaysian vs Sierra Leonean Median Family Income Correlation Chart

The statistical analysis conducted on geographies consisting of 225,953,352 people shows a weak negative correlation between the proportion of Malaysians and median family income in the United States with a correlation coefficient (R) of -0.237 and weighted average of $95,230. Similarly, the statistical analysis conducted on geographies consisting of 83,335,449 people shows a moderate negative correlation between the proportion of Sierra Leoneans and median family income in the United States with a correlation coefficient (R) of -0.421 and weighted average of $103,859, a difference of 9.1%.
Malaysian vs Sierra Leonean Median Family Income

Median Family Income Correlation Summary

MeasurementMalaysianSierra Leonean
Minimum$38,021$39,837
Maximum$123,750$170,916
Range$85,729$131,079
Mean$79,701$108,328
Median$78,842$106,551
Interquartile 25% (IQ1)$65,625$93,816
Interquartile 75% (IQ3)$93,739$120,017
Interquartile Range (IQR)$28,114$26,201
Standard Deviation (Sample)$19,147$26,389
Standard Deviation (Population)$19,025$26,156

Similar Demographics by Median Family Income

Demographics Similar to Malaysians by Median Family Income

In terms of median family income, the demographic groups most similar to Malaysians are Marshallese ($95,293, a difference of 0.070%), Ecuadorian ($95,114, a difference of 0.12%), Immigrants from the Azores ($95,402, a difference of 0.18%), Immigrants from Venezuela ($94,904, a difference of 0.34%), and Alaska Native ($95,573, a difference of 0.36%).
DemographicsRating | RankMedian Family Income
Venezuelans
3.7
/100
|
#223
Tragic
$96,281
Immigrants | Nonimmigrants
3.6
/100
|
#224
Tragic
$96,231
Vietnamese
3.4
/100
|
#225
Tragic
$96,123
Immigrants | Panama
2.7
/100
|
#226
Tragic
$95,647
Alaska Natives
2.6
/100
|
#227
Tragic
$95,573
Immigrants | Azores
2.4
/100
|
#228
Tragic
$95,402
Marshallese
2.2
/100
|
#229
Tragic
$95,293
Malaysians
2.2
/100
|
#230
Tragic
$95,230
Ecuadorians
2.1
/100
|
#231
Tragic
$95,114
Immigrants | Venezuela
1.9
/100
|
#232
Tragic
$94,904
Immigrants | Bangladesh
1.6
/100
|
#233
Tragic
$94,665
Immigrants | Western Africa
1.6
/100
|
#234
Tragic
$94,638
Immigrants | Burma/Myanmar
1.5
/100
|
#235
Tragic
$94,472
Trinidadians and Tobagonians
1.5
/100
|
#236
Tragic
$94,466
Alaskan Athabascans
1.5
/100
|
#237
Tragic
$94,429

Demographics Similar to Sierra Leoneans by Median Family Income

In terms of median family income, the demographic groups most similar to Sierra Leoneans are Immigrants from Sierra Leone ($103,990, a difference of 0.13%), Costa Rican ($103,989, a difference of 0.13%), Slovak ($103,729, a difference of 0.13%), English ($103,684, a difference of 0.17%), and South American Indian ($103,624, a difference of 0.23%).
DemographicsRating | RankMedian Family Income
Moroccans
71.6
/100
|
#157
Good
$104,488
Scandinavians
70.8
/100
|
#158
Good
$104,410
Swiss
70.7
/100
|
#159
Good
$104,396
Scottish
69.5
/100
|
#160
Good
$104,288
Icelanders
69.4
/100
|
#161
Good
$104,282
Immigrants | Sierra Leone
66.2
/100
|
#162
Good
$103,990
Costa Ricans
66.2
/100
|
#163
Good
$103,989
Sierra Leoneans
64.7
/100
|
#164
Good
$103,859
Slovaks
63.1
/100
|
#165
Good
$103,729
English
62.6
/100
|
#166
Good
$103,684
South American Indians
61.9
/100
|
#167
Good
$103,624
Immigrants | Peru
60.8
/100
|
#168
Good
$103,534
Czechoslovakians
57.6
/100
|
#169
Average
$103,273
Immigrants | Uzbekistan
56.6
/100
|
#170
Average
$103,197
Alsatians
54.3
/100
|
#171
Average
$103,010