Luxembourger vs Sri Lankan Median Family Income
COMPARE
Luxembourger
Sri Lankan
Median Family Income
Median Family Income Comparison
Luxembourgers
Sri Lankans
$106,183
MEDIAN FAMILY INCOME
85.7/ 100
METRIC RATING
139th/ 347
METRIC RANK
$108,234
MEDIAN FAMILY INCOME
94.5/ 100
METRIC RATING
119th/ 347
METRIC RANK
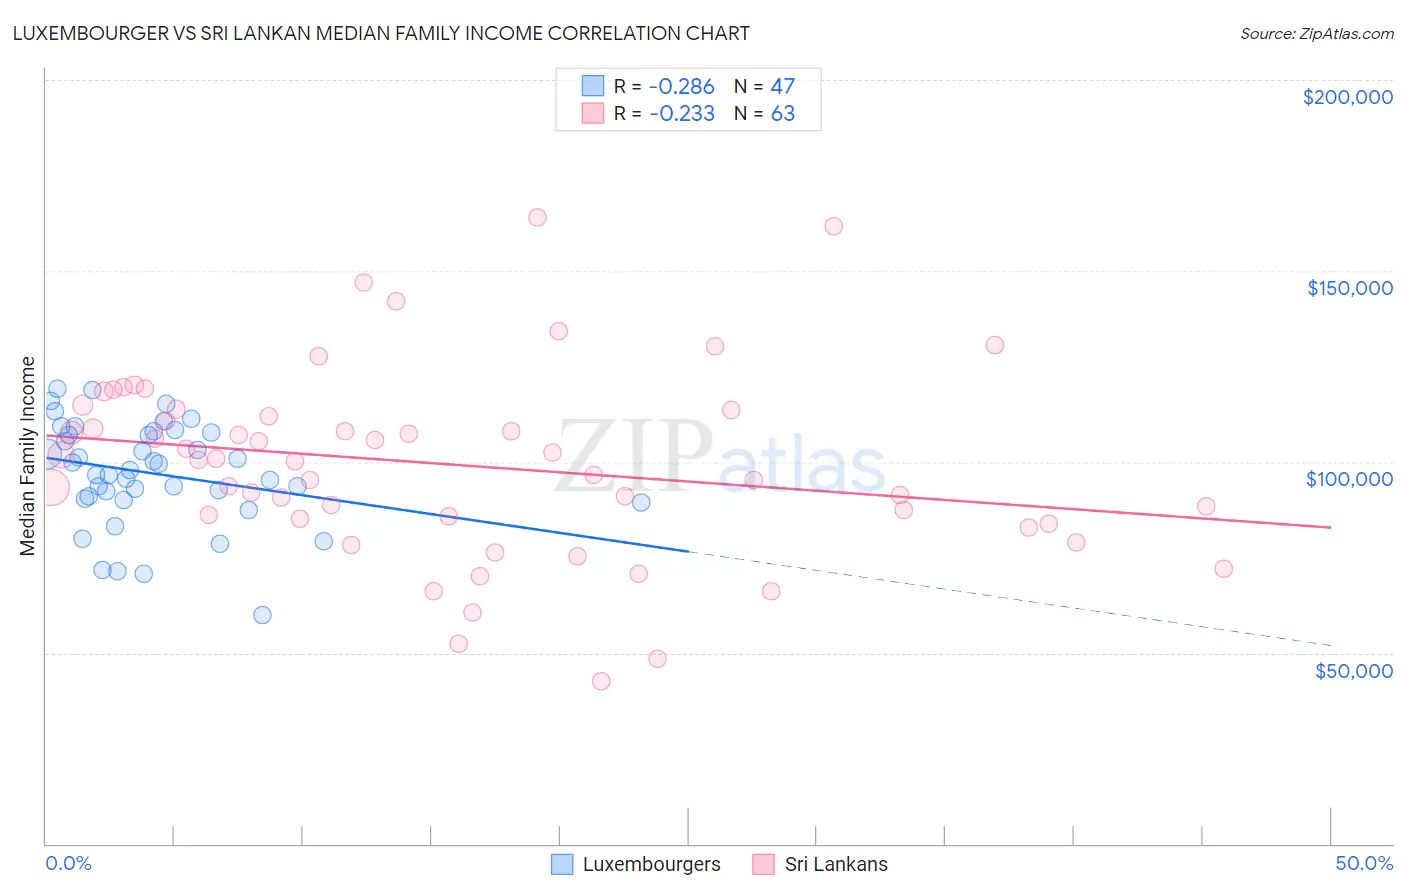
Luxembourger vs Sri Lankan Median Family Income Correlation Chart
The statistical analysis conducted on geographies consisting of 144,621,768 people shows a weak negative correlation between the proportion of Luxembourgers and median family income in the United States with a correlation coefficient (R) of -0.286 and weighted average of $106,183. Similarly, the statistical analysis conducted on geographies consisting of 439,902,823 people shows a weak negative correlation between the proportion of Sri Lankans and median family income in the United States with a correlation coefficient (R) of -0.233 and weighted average of $108,234, a difference of 1.9%.
Median Family Income Correlation Summary
| Measurement | Luxembourger | Sri Lankan |
| Minimum | $59,760 | $42,404 |
| Maximum | $119,103 | $164,143 |
| Range | $59,343 | $121,739 |
| Mean | $97,013 | $99,316 |
| Median | $97,838 | $100,475 |
| Interquartile 25% (IQ1) | $90,352 | $84,952 |
| Interquartile 75% (IQ3) | $107,750 | $113,711 |
| Interquartile Range (IQR) | $17,398 | $28,760 |
| Standard Deviation (Sample) | $13,448 | $24,633 |
| Standard Deviation (Population) | $13,305 | $24,437 |
Demographics Similar to Luxembourgers and Sri Lankans by Median Family Income
In terms of median family income, the demographic groups most similar to Luxembourgers are Immigrants from Uganda ($106,188, a difference of 0.0%), Immigrants from Vietnam ($106,186, a difference of 0.0%), Immigrants from South Eastern Asia ($106,252, a difference of 0.060%), Portuguese ($106,286, a difference of 0.10%), and Immigrants from Oceania ($106,453, a difference of 0.25%). Similarly, the demographic groups most similar to Sri Lankans are Immigrants from Northern Africa ($108,161, a difference of 0.070%), European ($108,099, a difference of 0.12%), Immigrants from Jordan ($107,715, a difference of 0.48%), Carpatho Rusyn ($107,502, a difference of 0.68%), and Pakistani ($107,390, a difference of 0.79%).
| Demographics | Rating | Rank | Median Family Income |
| Sri Lankans | 94.5 /100 | #119 | Exceptional $108,234 |
| Immigrants | Northern Africa | 94.3 /100 | #120 | Exceptional $108,161 |
| Europeans | 94.1 /100 | #121 | Exceptional $108,099 |
| Immigrants | Jordan | 92.9 /100 | #122 | Exceptional $107,715 |
| Carpatho Rusyns | 92.2 /100 | #123 | Exceptional $107,502 |
| Pakistanis | 91.7 /100 | #124 | Exceptional $107,390 |
| Taiwanese | 91.4 /100 | #125 | Exceptional $107,295 |
| Serbians | 90.8 /100 | #126 | Exceptional $107,157 |
| Lebanese | 90.5 /100 | #127 | Exceptional $107,086 |
| Immigrants | Ethiopia | 90.0 /100 | #128 | Excellent $106,969 |
| Arabs | 89.9 /100 | #129 | Excellent $106,952 |
| Brazilians | 89.8 /100 | #130 | Excellent $106,942 |
| Canadians | 88.1 /100 | #131 | Excellent $106,597 |
| Immigrants | Fiji | 87.8 /100 | #132 | Excellent $106,544 |
| Ugandans | 87.8 /100 | #133 | Excellent $106,541 |
| Immigrants | Oceania | 87.3 /100 | #134 | Excellent $106,453 |
| Portuguese | 86.3 /100 | #135 | Excellent $106,286 |
| Immigrants | South Eastern Asia | 86.1 /100 | #136 | Excellent $106,252 |
| Immigrants | Uganda | 85.7 /100 | #137 | Excellent $106,188 |
| Immigrants | Vietnam | 85.7 /100 | #138 | Excellent $106,186 |
| Luxembourgers | 85.7 /100 | #139 | Excellent $106,183 |