Luxembourger vs Immigrants from Vietnam Median Family Income
COMPARE
Luxembourger
Immigrants from Vietnam
Median Family Income
Median Family Income Comparison
Luxembourgers
Immigrants from Vietnam
$106,183
MEDIAN FAMILY INCOME
85.7/ 100
METRIC RATING
139th/ 347
METRIC RANK
$106,186
MEDIAN FAMILY INCOME
85.7/ 100
METRIC RATING
138th/ 347
METRIC RANK
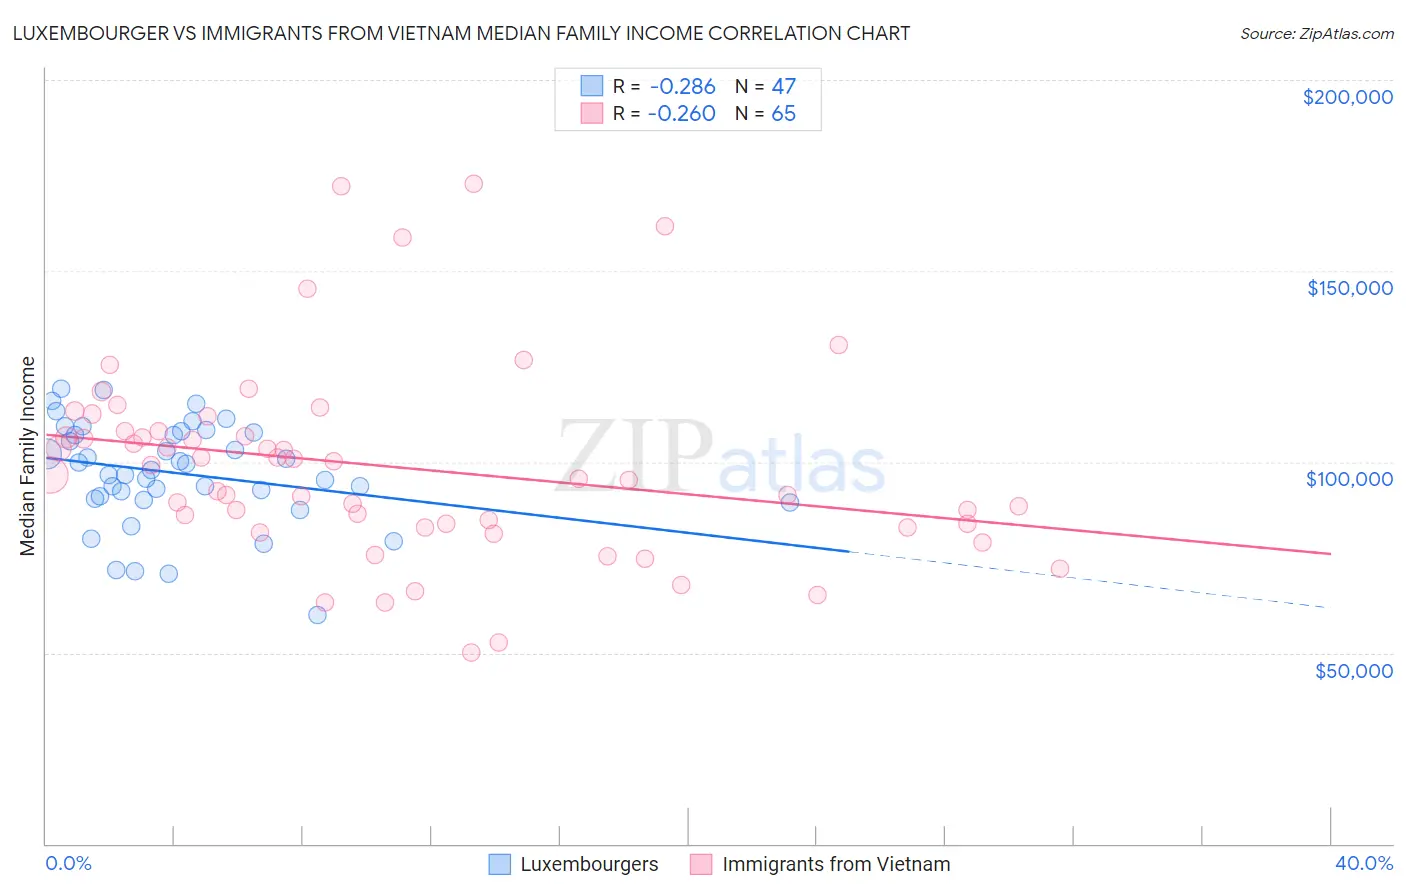
Luxembourger vs Immigrants from Vietnam Median Family Income Correlation Chart
The statistical analysis conducted on geographies consisting of 144,621,768 people shows a weak negative correlation between the proportion of Luxembourgers and median family income in the United States with a correlation coefficient (R) of -0.286 and weighted average of $106,183. Similarly, the statistical analysis conducted on geographies consisting of 404,425,840 people shows a weak negative correlation between the proportion of Immigrants from Vietnam and median family income in the United States with a correlation coefficient (R) of -0.260 and weighted average of $106,186, a difference of 0.0%.
Median Family Income Correlation Summary
| Measurement | Luxembourger | Immigrants from Vietnam |
| Minimum | $59,760 | $50,204 |
| Maximum | $119,103 | $172,860 |
| Range | $59,343 | $122,656 |
| Mean | $97,013 | $98,743 |
| Median | $97,838 | $96,507 |
| Interquartile 25% (IQ1) | $90,352 | $83,286 |
| Interquartile 75% (IQ3) | $107,750 | $108,037 |
| Interquartile Range (IQR) | $17,398 | $24,751 |
| Standard Deviation (Sample) | $13,448 | $25,431 |
| Standard Deviation (Population) | $13,305 | $25,234 |
Demographics Similar to Luxembourgers and Immigrants from Vietnam by Median Family Income
In terms of median family income, the demographic groups most similar to Luxembourgers are Immigrants from Uganda ($106,188, a difference of 0.0%), Norwegian ($106,144, a difference of 0.040%), Immigrants from South Eastern Asia ($106,252, a difference of 0.060%), Immigrants from Syria ($106,118, a difference of 0.060%), and Portuguese ($106,286, a difference of 0.10%). Similarly, the demographic groups most similar to Immigrants from Vietnam are Immigrants from Uganda ($106,188, a difference of 0.0%), Norwegian ($106,144, a difference of 0.040%), Immigrants from South Eastern Asia ($106,252, a difference of 0.060%), Immigrants from Syria ($106,118, a difference of 0.060%), and Portuguese ($106,286, a difference of 0.090%).
| Demographics | Rating | Rank | Median Family Income |
| Immigrants | Ethiopia | 90.0 /100 | #128 | Excellent $106,969 |
| Arabs | 89.9 /100 | #129 | Excellent $106,952 |
| Brazilians | 89.8 /100 | #130 | Excellent $106,942 |
| Canadians | 88.1 /100 | #131 | Excellent $106,597 |
| Immigrants | Fiji | 87.8 /100 | #132 | Excellent $106,544 |
| Ugandans | 87.8 /100 | #133 | Excellent $106,541 |
| Immigrants | Oceania | 87.3 /100 | #134 | Excellent $106,453 |
| Portuguese | 86.3 /100 | #135 | Excellent $106,286 |
| Immigrants | South Eastern Asia | 86.1 /100 | #136 | Excellent $106,252 |
| Immigrants | Uganda | 85.7 /100 | #137 | Excellent $106,188 |
| Immigrants | Vietnam | 85.7 /100 | #138 | Excellent $106,186 |
| Luxembourgers | 85.7 /100 | #139 | Excellent $106,183 |
| Norwegians | 85.5 /100 | #140 | Excellent $106,144 |
| Immigrants | Syria | 85.3 /100 | #141 | Excellent $106,118 |
| Slovenes | 84.7 /100 | #142 | Excellent $106,020 |
| Tongans | 84.3 /100 | #143 | Excellent $105,967 |
| Immigrants | Morocco | 84.3 /100 | #144 | Excellent $105,964 |
| Danes | 83.8 /100 | #145 | Excellent $105,900 |
| Czechs | 83.4 /100 | #146 | Excellent $105,839 |
| Immigrants | Chile | 82.1 /100 | #147 | Excellent $105,655 |
| Hungarians | 81.7 /100 | #148 | Excellent $105,609 |