Luxembourger vs Hungarian Median Family Income
COMPARE
Luxembourger
Hungarian
Median Family Income
Median Family Income Comparison
Luxembourgers
Hungarians
$106,183
MEDIAN FAMILY INCOME
85.7/ 100
METRIC RATING
139th/ 347
METRIC RANK
$105,609
MEDIAN FAMILY INCOME
81.7/ 100
METRIC RATING
148th/ 347
METRIC RANK
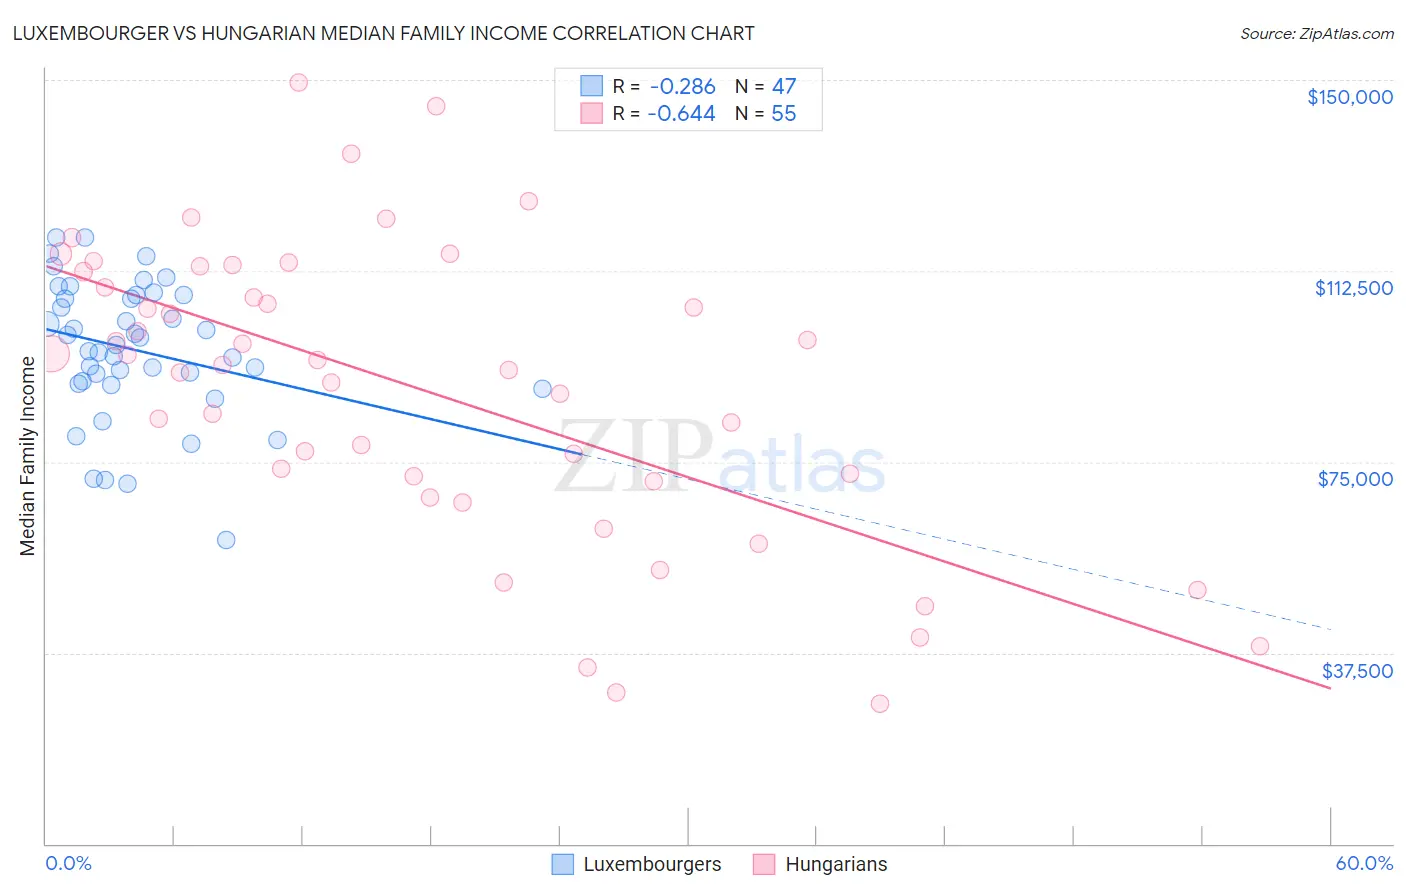
Luxembourger vs Hungarian Median Family Income Correlation Chart
The statistical analysis conducted on geographies consisting of 144,621,768 people shows a weak negative correlation between the proportion of Luxembourgers and median family income in the United States with a correlation coefficient (R) of -0.286 and weighted average of $106,183. Similarly, the statistical analysis conducted on geographies consisting of 485,642,257 people shows a significant negative correlation between the proportion of Hungarians and median family income in the United States with a correlation coefficient (R) of -0.644 and weighted average of $105,609, a difference of 0.54%.
Median Family Income Correlation Summary
| Measurement | Luxembourger | Hungarian |
| Minimum | $59,760 | $27,438 |
| Maximum | $119,103 | $149,519 |
| Range | $59,343 | $122,081 |
| Mean | $97,013 | $89,113 |
| Median | $97,838 | $94,101 |
| Interquartile 25% (IQ1) | $90,352 | $71,250 |
| Interquartile 75% (IQ3) | $107,750 | $112,341 |
| Interquartile Range (IQR) | $17,398 | $41,091 |
| Standard Deviation (Sample) | $13,448 | $29,093 |
| Standard Deviation (Population) | $13,305 | $28,828 |
Demographics Similar to Luxembourgers and Hungarians by Median Family Income
In terms of median family income, the demographic groups most similar to Luxembourgers are Immigrants from Uganda ($106,188, a difference of 0.0%), Immigrants from Vietnam ($106,186, a difference of 0.0%), Norwegian ($106,144, a difference of 0.040%), Immigrants from South Eastern Asia ($106,252, a difference of 0.060%), and Immigrants from Syria ($106,118, a difference of 0.060%). Similarly, the demographic groups most similar to Hungarians are Immigrants from Chile ($105,655, a difference of 0.040%), Immigrants from Germany ($105,507, a difference of 0.10%), Irish ($105,453, a difference of 0.15%), Peruvian ($105,444, a difference of 0.16%), and Czech ($105,839, a difference of 0.22%).
| Demographics | Rating | Rank | Median Family Income |
| Ugandans | 87.8 /100 | #133 | Excellent $106,541 |
| Immigrants | Oceania | 87.3 /100 | #134 | Excellent $106,453 |
| Portuguese | 86.3 /100 | #135 | Excellent $106,286 |
| Immigrants | South Eastern Asia | 86.1 /100 | #136 | Excellent $106,252 |
| Immigrants | Uganda | 85.7 /100 | #137 | Excellent $106,188 |
| Immigrants | Vietnam | 85.7 /100 | #138 | Excellent $106,186 |
| Luxembourgers | 85.7 /100 | #139 | Excellent $106,183 |
| Norwegians | 85.5 /100 | #140 | Excellent $106,144 |
| Immigrants | Syria | 85.3 /100 | #141 | Excellent $106,118 |
| Slovenes | 84.7 /100 | #142 | Excellent $106,020 |
| Tongans | 84.3 /100 | #143 | Excellent $105,967 |
| Immigrants | Morocco | 84.3 /100 | #144 | Excellent $105,964 |
| Danes | 83.8 /100 | #145 | Excellent $105,900 |
| Czechs | 83.4 /100 | #146 | Excellent $105,839 |
| Immigrants | Chile | 82.1 /100 | #147 | Excellent $105,655 |
| Hungarians | 81.7 /100 | #148 | Excellent $105,609 |
| Immigrants | Germany | 80.9 /100 | #149 | Excellent $105,507 |
| Irish | 80.5 /100 | #150 | Excellent $105,453 |
| Peruvians | 80.4 /100 | #151 | Excellent $105,444 |
| Immigrants | Albania | 79.1 /100 | #152 | Good $105,285 |
| Slavs | 77.9 /100 | #153 | Good $105,144 |