Luxembourger vs Sri Lankan 11th Grade
COMPARE
Luxembourger
Sri Lankan
11th Grade
11th Grade Comparison
Luxembourgers
Sri Lankans
94.5%
11TH GRADE
100.0/ 100
METRIC RATING
17th/ 347
METRIC RANK
90.7%
11TH GRADE
0.0/ 100
METRIC RATING
280th/ 347
METRIC RANK
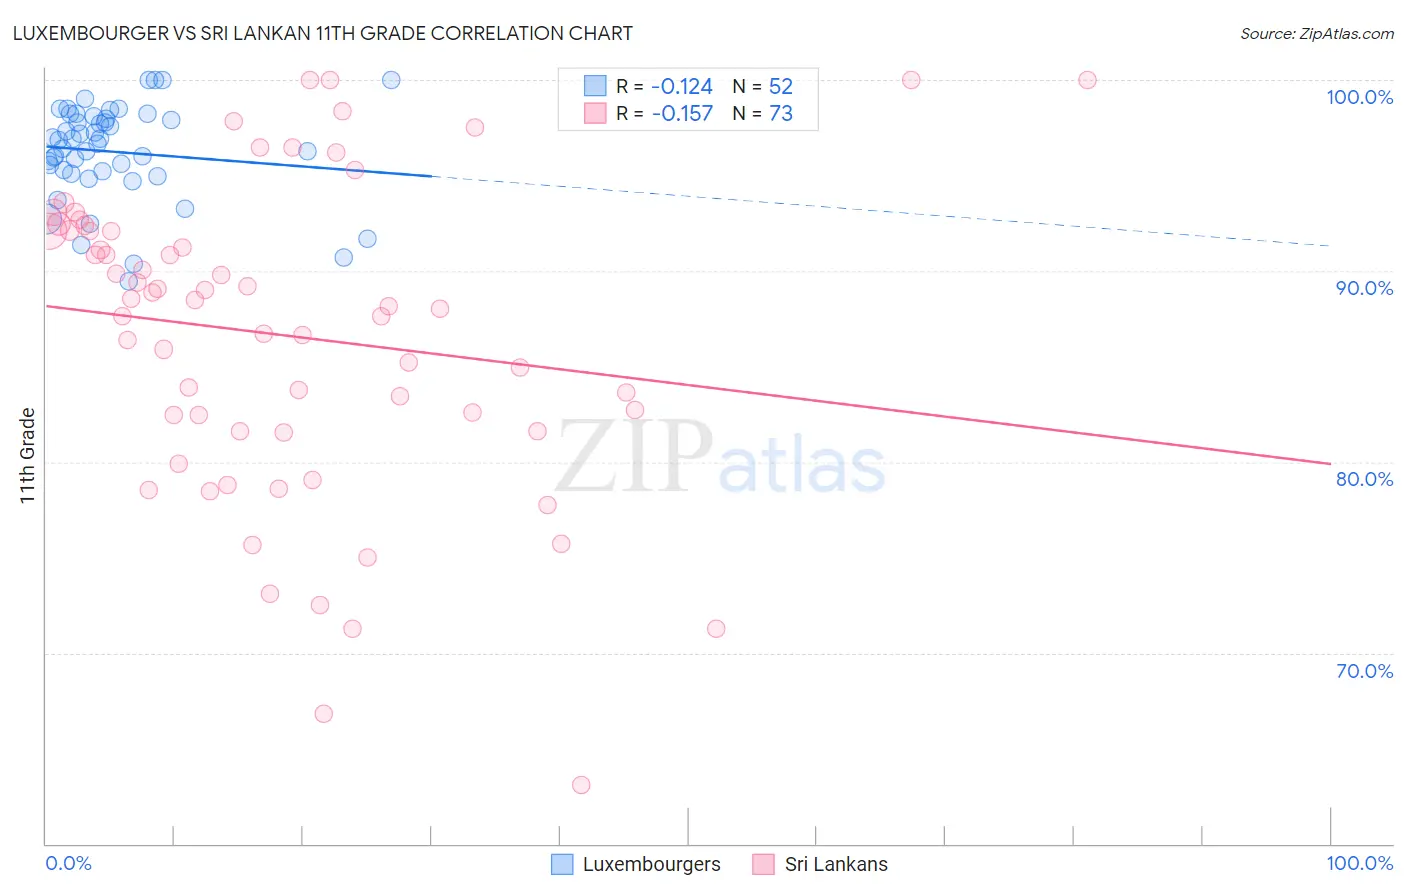
Luxembourger vs Sri Lankan 11th Grade Correlation Chart
The statistical analysis conducted on geographies consisting of 144,675,955 people shows a poor negative correlation between the proportion of Luxembourgers and percentage of population with at least 11th grade education in the United States with a correlation coefficient (R) of -0.124 and weighted average of 94.5%. Similarly, the statistical analysis conducted on geographies consisting of 440,593,537 people shows a poor negative correlation between the proportion of Sri Lankans and percentage of population with at least 11th grade education in the United States with a correlation coefficient (R) of -0.157 and weighted average of 90.7%, a difference of 4.2%.
11th Grade Correlation Summary
| Measurement | Luxembourger | Sri Lankan |
| Minimum | 89.4% | 63.1% |
| Maximum | 100.0% | 100.0% |
| Range | 10.6% | 36.9% |
| Mean | 96.2% | 86.6% |
| Median | 96.8% | 88.1% |
| Interquartile 25% (IQ1) | 95.2% | 81.6% |
| Interquartile 75% (IQ3) | 98.0% | 92.1% |
| Interquartile Range (IQR) | 2.9% | 10.5% |
| Standard Deviation (Sample) | 2.5% | 8.2% |
| Standard Deviation (Population) | 2.5% | 8.1% |
Similar Demographics by 11th Grade
Demographics Similar to Luxembourgers by 11th Grade
In terms of 11th grade, the demographic groups most similar to Luxembourgers are Immigrants from India (94.5%, a difference of 0.0%), Maltese (94.5%, a difference of 0.0%), Bulgarian (94.5%, a difference of 0.010%), Scandinavian (94.5%, a difference of 0.010%), and Italian (94.5%, a difference of 0.040%).
| Demographics | Rating | Rank | 11th Grade |
| Finns | 100.0 /100 | #10 | Exceptional 94.7% |
| Germans | 100.0 /100 | #11 | Exceptional 94.7% |
| Latvians | 100.0 /100 | #12 | Exceptional 94.7% |
| Chinese | 100.0 /100 | #13 | Exceptional 94.6% |
| Eastern Europeans | 100.0 /100 | #14 | Exceptional 94.6% |
| Bulgarians | 100.0 /100 | #15 | Exceptional 94.5% |
| Immigrants | India | 100.0 /100 | #16 | Exceptional 94.5% |
| Luxembourgers | 100.0 /100 | #17 | Exceptional 94.5% |
| Maltese | 100.0 /100 | #18 | Exceptional 94.5% |
| Scandinavians | 100.0 /100 | #19 | Exceptional 94.5% |
| Italians | 100.0 /100 | #20 | Exceptional 94.5% |
| Tlingit-Haida | 100.0 /100 | #21 | Exceptional 94.4% |
| Tsimshian | 100.0 /100 | #22 | Exceptional 94.4% |
| Czechs | 100.0 /100 | #23 | Exceptional 94.4% |
| English | 100.0 /100 | #24 | Exceptional 94.4% |
Demographics Similar to Sri Lankans by 11th Grade
In terms of 11th grade, the demographic groups most similar to Sri Lankans are Dutch West Indian (90.7%, a difference of 0.050%), Barbadian (90.8%, a difference of 0.060%), Immigrants from St. Vincent and the Grenadines (90.7%, a difference of 0.060%), Immigrants from Barbados (90.7%, a difference of 0.070%), and Malaysian (90.8%, a difference of 0.11%).
| Demographics | Rating | Rank | 11th Grade |
| Paiute | 0.1 /100 | #273 | Tragic 91.0% |
| Immigrants | Trinidad and Tobago | 0.1 /100 | #274 | Tragic 90.9% |
| Immigrants | South Eastern Asia | 0.1 /100 | #275 | Tragic 90.9% |
| Bangladeshis | 0.1 /100 | #276 | Tragic 90.9% |
| Immigrants | Congo | 0.1 /100 | #277 | Tragic 90.9% |
| Malaysians | 0.1 /100 | #278 | Tragic 90.8% |
| Barbadians | 0.0 /100 | #279 | Tragic 90.8% |
| Sri Lankans | 0.0 /100 | #280 | Tragic 90.7% |
| Dutch West Indians | 0.0 /100 | #281 | Tragic 90.7% |
| Immigrants | St. Vincent and the Grenadines | 0.0 /100 | #282 | Tragic 90.7% |
| Immigrants | Barbados | 0.0 /100 | #283 | Tragic 90.7% |
| Immigrants | Laos | 0.0 /100 | #284 | Tragic 90.5% |
| Immigrants | Burma/Myanmar | 0.0 /100 | #285 | Tragic 90.4% |
| Immigrants | West Indies | 0.0 /100 | #286 | Tragic 90.4% |
| Apache | 0.0 /100 | #287 | Tragic 90.4% |