Immigrants from Switzerland vs Sri Lankan Median Family Income
COMPARE
Immigrants from Switzerland
Sri Lankan
Median Family Income
Median Family Income Comparison
Immigrants from Switzerland
Sri Lankans
$120,726
MEDIAN FAMILY INCOME
100.0/ 100
METRIC RATING
26th/ 347
METRIC RANK
$108,234
MEDIAN FAMILY INCOME
94.5/ 100
METRIC RATING
119th/ 347
METRIC RANK
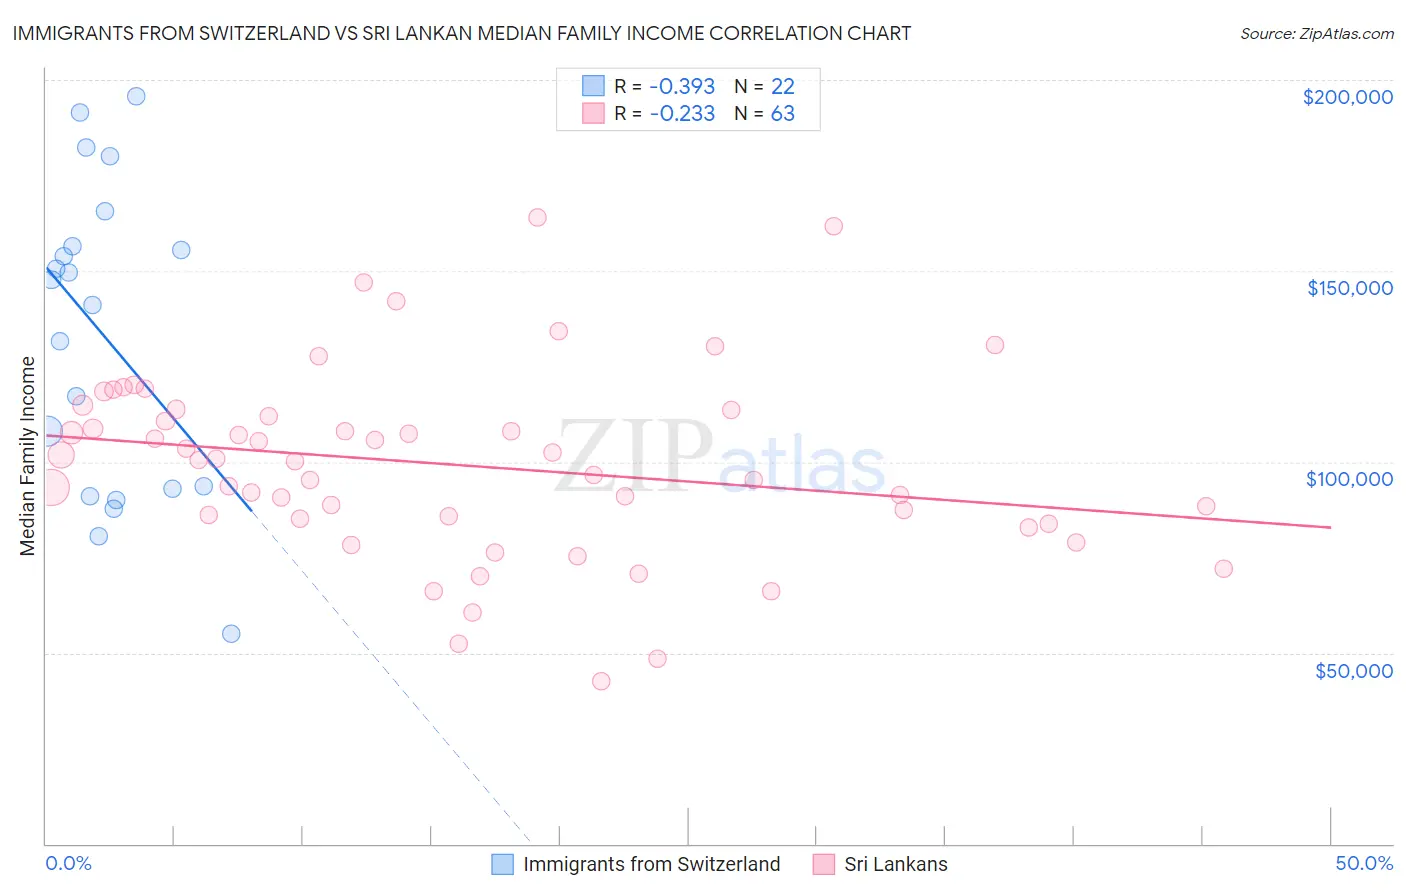
Immigrants from Switzerland vs Sri Lankan Median Family Income Correlation Chart
The statistical analysis conducted on geographies consisting of 148,050,158 people shows a mild negative correlation between the proportion of Immigrants from Switzerland and median family income in the United States with a correlation coefficient (R) of -0.393 and weighted average of $120,726. Similarly, the statistical analysis conducted on geographies consisting of 439,902,823 people shows a weak negative correlation between the proportion of Sri Lankans and median family income in the United States with a correlation coefficient (R) of -0.233 and weighted average of $108,234, a difference of 11.5%.
Median Family Income Correlation Summary
| Measurement | Immigrants from Switzerland | Sri Lankan |
| Minimum | $55,000 | $42,404 |
| Maximum | $195,586 | $164,143 |
| Range | $140,586 | $121,739 |
| Mean | $132,599 | $99,316 |
| Median | $144,292 | $100,475 |
| Interquartile 25% (IQ1) | $92,813 | $84,952 |
| Interquartile 75% (IQ3) | $156,420 | $113,711 |
| Interquartile Range (IQR) | $63,607 | $28,760 |
| Standard Deviation (Sample) | $40,204 | $24,633 |
| Standard Deviation (Population) | $39,280 | $24,437 |
Similar Demographics by Median Family Income
Demographics Similar to Immigrants from Switzerland by Median Family Income
In terms of median family income, the demographic groups most similar to Immigrants from Switzerland are Russian ($120,487, a difference of 0.20%), Immigrants from Denmark ($120,445, a difference of 0.23%), Latvian ($120,301, a difference of 0.35%), Turkish ($121,202, a difference of 0.39%), and Immigrants from Sri Lanka ($120,263, a difference of 0.39%).
| Demographics | Rating | Rank | Median Family Income |
| Immigrants | Belgium | 100.0 /100 | #19 | Exceptional $123,831 |
| Burmese | 100.0 /100 | #20 | Exceptional $123,369 |
| Immigrants | Korea | 100.0 /100 | #21 | Exceptional $122,800 |
| Immigrants | Sweden | 100.0 /100 | #22 | Exceptional $122,765 |
| Immigrants | Japan | 100.0 /100 | #23 | Exceptional $122,764 |
| Immigrants | Northern Europe | 100.0 /100 | #24 | Exceptional $121,840 |
| Turks | 100.0 /100 | #25 | Exceptional $121,202 |
| Immigrants | Switzerland | 100.0 /100 | #26 | Exceptional $120,726 |
| Russians | 100.0 /100 | #27 | Exceptional $120,487 |
| Immigrants | Denmark | 100.0 /100 | #28 | Exceptional $120,445 |
| Latvians | 100.0 /100 | #29 | Exceptional $120,301 |
| Immigrants | Sri Lanka | 100.0 /100 | #30 | Exceptional $120,263 |
| Immigrants | France | 100.0 /100 | #31 | Exceptional $120,076 |
| Asians | 100.0 /100 | #32 | Exceptional $119,955 |
| Bhutanese | 100.0 /100 | #33 | Exceptional $119,800 |
Demographics Similar to Sri Lankans by Median Family Income
In terms of median family income, the demographic groups most similar to Sri Lankans are Ethiopian ($108,251, a difference of 0.020%), Immigrants from Philippines ($108,288, a difference of 0.050%), Immigrants from Northern Africa ($108,161, a difference of 0.070%), European ($108,099, a difference of 0.12%), and Chilean ($108,429, a difference of 0.18%).
| Demographics | Rating | Rank | Median Family Income |
| Immigrants | Poland | 95.3 /100 | #112 | Exceptional $108,570 |
| Immigrants | Saudi Arabia | 95.2 /100 | #113 | Exceptional $108,544 |
| Poles | 95.2 /100 | #114 | Exceptional $108,507 |
| Swedes | 95.1 /100 | #115 | Exceptional $108,499 |
| Chileans | 95.0 /100 | #116 | Exceptional $108,429 |
| Immigrants | Philippines | 94.6 /100 | #117 | Exceptional $108,288 |
| Ethiopians | 94.5 /100 | #118 | Exceptional $108,251 |
| Sri Lankans | 94.5 /100 | #119 | Exceptional $108,234 |
| Immigrants | Northern Africa | 94.3 /100 | #120 | Exceptional $108,161 |
| Europeans | 94.1 /100 | #121 | Exceptional $108,099 |
| Immigrants | Jordan | 92.9 /100 | #122 | Exceptional $107,715 |
| Carpatho Rusyns | 92.2 /100 | #123 | Exceptional $107,502 |
| Pakistanis | 91.7 /100 | #124 | Exceptional $107,390 |
| Taiwanese | 91.4 /100 | #125 | Exceptional $107,295 |
| Serbians | 90.8 /100 | #126 | Exceptional $107,157 |