Luxembourger vs Basque Median Family Income
COMPARE
Luxembourger
Basque
Median Family Income
Median Family Income Comparison
Luxembourgers
Basques
$106,183
MEDIAN FAMILY INCOME
85.7/ 100
METRIC RATING
139th/ 347
METRIC RANK
$104,760
MEDIAN FAMILY INCOME
74.4/ 100
METRIC RATING
156th/ 347
METRIC RANK
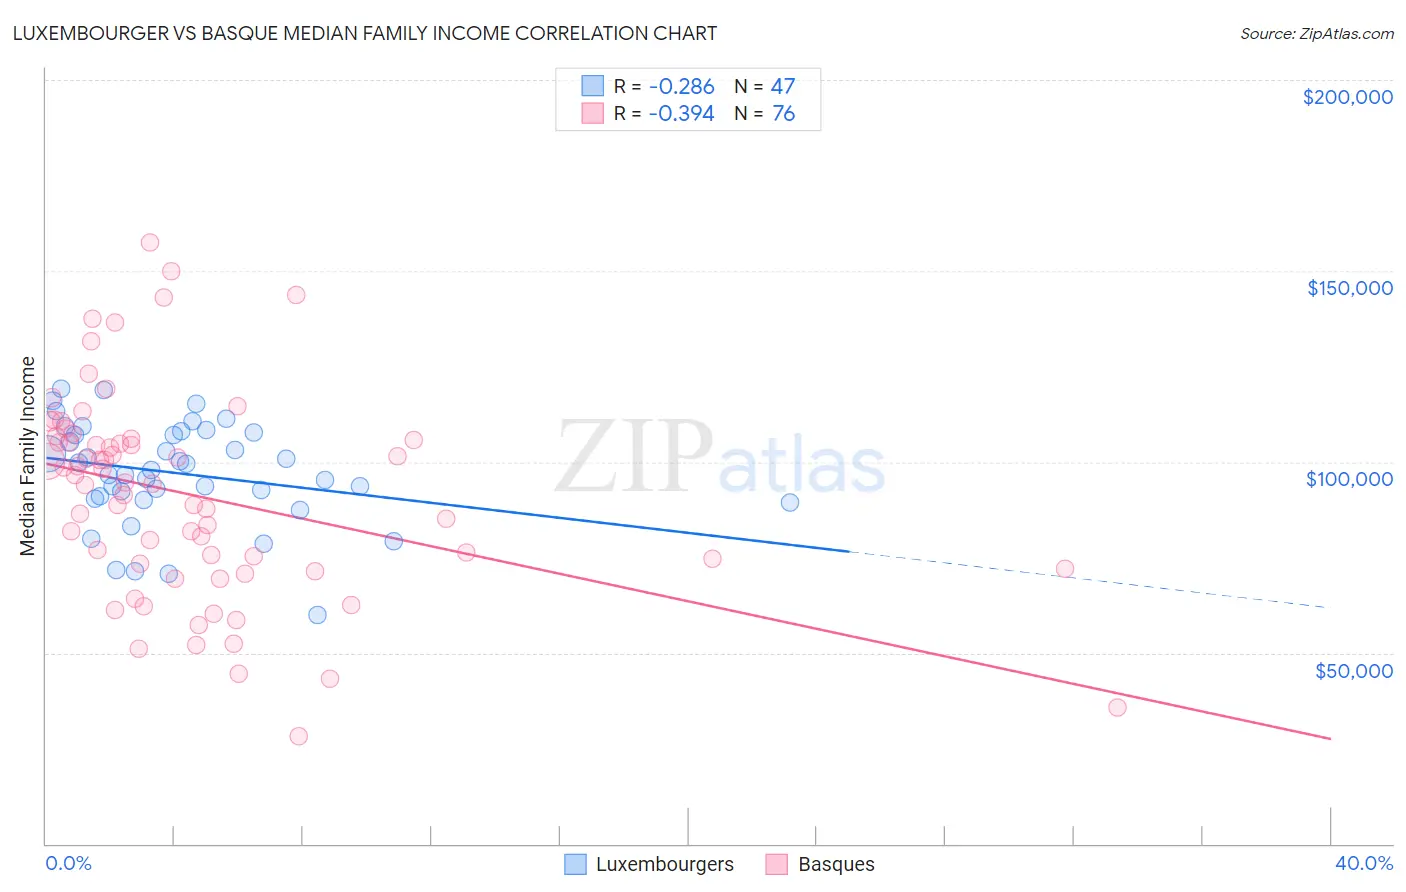
Luxembourger vs Basque Median Family Income Correlation Chart
The statistical analysis conducted on geographies consisting of 144,621,768 people shows a weak negative correlation between the proportion of Luxembourgers and median family income in the United States with a correlation coefficient (R) of -0.286 and weighted average of $106,183. Similarly, the statistical analysis conducted on geographies consisting of 165,742,125 people shows a mild negative correlation between the proportion of Basques and median family income in the United States with a correlation coefficient (R) of -0.394 and weighted average of $104,760, a difference of 1.4%.
Median Family Income Correlation Summary
| Measurement | Luxembourger | Basque |
| Minimum | $59,760 | $28,036 |
| Maximum | $119,103 | $157,351 |
| Range | $59,343 | $129,315 |
| Mean | $97,013 | $91,256 |
| Median | $97,838 | $94,457 |
| Interquartile 25% (IQ1) | $90,352 | $72,725 |
| Interquartile 75% (IQ3) | $107,750 | $105,919 |
| Interquartile Range (IQR) | $17,398 | $33,194 |
| Standard Deviation (Sample) | $13,448 | $26,783 |
| Standard Deviation (Population) | $13,305 | $26,606 |
Demographics Similar to Luxembourgers and Basques by Median Family Income
In terms of median family income, the demographic groups most similar to Luxembourgers are Immigrants from Uganda ($106,188, a difference of 0.0%), Immigrants from Vietnam ($106,186, a difference of 0.0%), Norwegian ($106,144, a difference of 0.040%), Immigrants from Syria ($106,118, a difference of 0.060%), and Slovene ($106,020, a difference of 0.15%). Similarly, the demographic groups most similar to Basques are Native Hawaiian ($104,910, a difference of 0.14%), Immigrants from Nepal ($104,966, a difference of 0.20%), Moroccan ($104,488, a difference of 0.26%), Slavic ($105,144, a difference of 0.37%), and Immigrants from Albania ($105,285, a difference of 0.50%).
| Demographics | Rating | Rank | Median Family Income |
| Immigrants | Uganda | 85.7 /100 | #137 | Excellent $106,188 |
| Immigrants | Vietnam | 85.7 /100 | #138 | Excellent $106,186 |
| Luxembourgers | 85.7 /100 | #139 | Excellent $106,183 |
| Norwegians | 85.5 /100 | #140 | Excellent $106,144 |
| Immigrants | Syria | 85.3 /100 | #141 | Excellent $106,118 |
| Slovenes | 84.7 /100 | #142 | Excellent $106,020 |
| Tongans | 84.3 /100 | #143 | Excellent $105,967 |
| Immigrants | Morocco | 84.3 /100 | #144 | Excellent $105,964 |
| Danes | 83.8 /100 | #145 | Excellent $105,900 |
| Czechs | 83.4 /100 | #146 | Excellent $105,839 |
| Immigrants | Chile | 82.1 /100 | #147 | Excellent $105,655 |
| Hungarians | 81.7 /100 | #148 | Excellent $105,609 |
| Immigrants | Germany | 80.9 /100 | #149 | Excellent $105,507 |
| Irish | 80.5 /100 | #150 | Excellent $105,453 |
| Peruvians | 80.4 /100 | #151 | Excellent $105,444 |
| Immigrants | Albania | 79.1 /100 | #152 | Good $105,285 |
| Slavs | 77.9 /100 | #153 | Good $105,144 |
| Immigrants | Nepal | 76.3 /100 | #154 | Good $104,966 |
| Native Hawaiians | 75.8 /100 | #155 | Good $104,910 |
| Basques | 74.4 /100 | #156 | Good $104,760 |
| Moroccans | 71.6 /100 | #157 | Good $104,488 |