Luxembourger vs Sierra Leonean Median Female Earnings
COMPARE
Luxembourger
Sierra Leonean
Median Female Earnings
Median Female Earnings Comparison
Luxembourgers
Sierra Leoneans
$39,891
MEDIAN FEMALE EARNINGS
59.9/ 100
METRIC RATING
167th/ 347
METRIC RANK
$42,868
MEDIAN FEMALE EARNINGS
99.9/ 100
METRIC RATING
65th/ 347
METRIC RANK
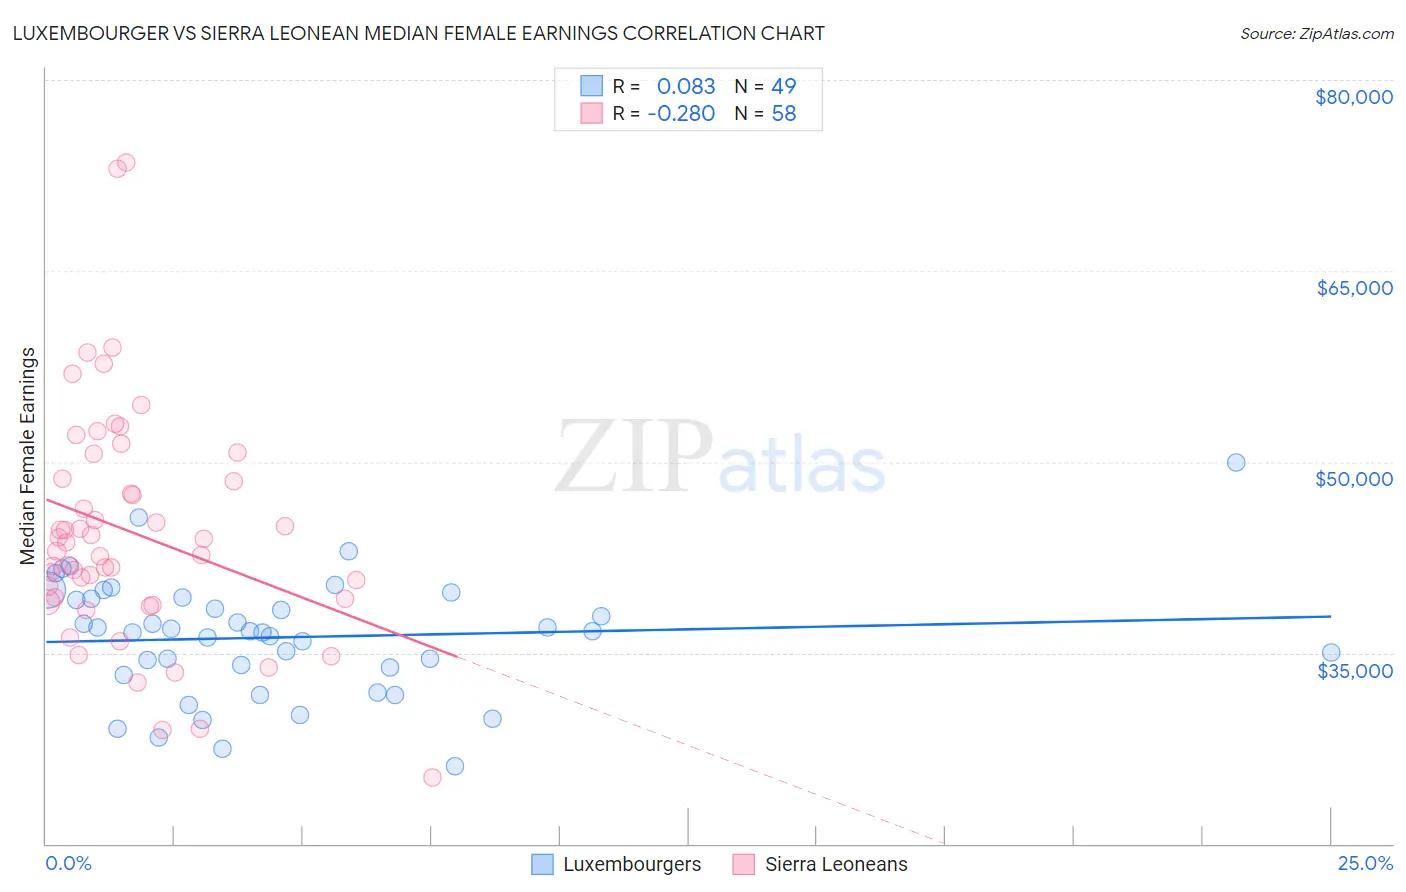
Luxembourger vs Sierra Leonean Median Female Earnings Correlation Chart
The statistical analysis conducted on geographies consisting of 144,650,946 people shows a slight positive correlation between the proportion of Luxembourgers and median female earnings in the United States with a correlation coefficient (R) of 0.083 and weighted average of $39,891. Similarly, the statistical analysis conducted on geographies consisting of 83,345,835 people shows a weak negative correlation between the proportion of Sierra Leoneans and median female earnings in the United States with a correlation coefficient (R) of -0.280 and weighted average of $42,868, a difference of 7.5%.
Median Female Earnings Correlation Summary
| Measurement | Luxembourger | Sierra Leonean |
| Minimum | $26,088 | $25,167 |
| Maximum | $50,000 | $73,523 |
| Range | $23,912 | $48,356 |
| Mean | $36,224 | $44,483 |
| Median | $36,648 | $43,304 |
| Interquartile 25% (IQ1) | $33,540 | $39,290 |
| Interquartile 75% (IQ3) | $39,298 | $48,705 |
| Interquartile Range (IQR) | $5,758 | $9,415 |
| Standard Deviation (Sample) | $4,701 | $9,174 |
| Standard Deviation (Population) | $4,653 | $9,094 |
Similar Demographics by Median Female Earnings
Demographics Similar to Luxembourgers by Median Female Earnings
In terms of median female earnings, the demographic groups most similar to Luxembourgers are Immigrants from Ghana ($39,894, a difference of 0.010%), Immigrants from Bangladesh ($39,910, a difference of 0.050%), Immigrants from Peru ($39,871, a difference of 0.050%), Kenyan ($39,860, a difference of 0.080%), and Immigrants from Saudi Arabia ($39,952, a difference of 0.15%).
| Demographics | Rating | Rank | Median Female Earnings |
| Inupiat | 68.9 /100 | #160 | Good $40,080 |
| Alsatians | 68.0 /100 | #161 | Good $40,060 |
| South American Indians | 66.1 /100 | #162 | Good $40,019 |
| Lebanese | 65.5 /100 | #163 | Good $40,006 |
| Immigrants | Saudi Arabia | 62.9 /100 | #164 | Good $39,952 |
| Immigrants | Bangladesh | 60.8 /100 | #165 | Good $39,910 |
| Immigrants | Ghana | 60.0 /100 | #166 | Good $39,894 |
| Luxembourgers | 59.9 /100 | #167 | Average $39,891 |
| Immigrants | Peru | 58.9 /100 | #168 | Average $39,871 |
| Kenyans | 58.4 /100 | #169 | Average $39,860 |
| Slovenes | 56.2 /100 | #170 | Average $39,817 |
| Immigrants | Portugal | 54.7 /100 | #171 | Average $39,788 |
| British | 53.8 /100 | #172 | Average $39,772 |
| Canadians | 51.4 /100 | #173 | Average $39,724 |
| South Americans | 50.0 /100 | #174 | Average $39,698 |
Demographics Similar to Sierra Leoneans by Median Female Earnings
In terms of median female earnings, the demographic groups most similar to Sierra Leoneans are Immigrants from Norway ($42,837, a difference of 0.070%), Immigrants from Egypt ($42,837, a difference of 0.070%), Immigrants from Austria ($42,824, a difference of 0.10%), Immigrants from Spain ($42,815, a difference of 0.12%), and Immigrants from Ethiopia ($42,744, a difference of 0.29%).
| Demographics | Rating | Rank | Median Female Earnings |
| Paraguayans | 99.9 /100 | #58 | Exceptional $43,173 |
| Estonians | 99.9 /100 | #59 | Exceptional $43,106 |
| Immigrants | Latvia | 99.9 /100 | #60 | Exceptional $43,099 |
| Immigrants | Bulgaria | 99.9 /100 | #61 | Exceptional $43,085 |
| Afghans | 99.9 /100 | #62 | Exceptional $43,077 |
| Immigrants | Ukraine | 99.9 /100 | #63 | Exceptional $43,069 |
| Immigrants | Pakistan | 99.9 /100 | #64 | Exceptional $43,052 |
| Sierra Leoneans | 99.9 /100 | #65 | Exceptional $42,868 |
| Immigrants | Norway | 99.9 /100 | #66 | Exceptional $42,837 |
| Immigrants | Egypt | 99.9 /100 | #67 | Exceptional $42,837 |
| Immigrants | Austria | 99.8 /100 | #68 | Exceptional $42,824 |
| Immigrants | Spain | 99.8 /100 | #69 | Exceptional $42,815 |
| Immigrants | Ethiopia | 99.8 /100 | #70 | Exceptional $42,744 |
| Immigrants | Romania | 99.8 /100 | #71 | Exceptional $42,718 |
| Albanians | 99.8 /100 | #72 | Exceptional $42,584 |