Immigrants from Zaire vs Sierra Leonean Median Female Earnings
COMPARE
Immigrants from Zaire
Sierra Leonean
Median Female Earnings
Median Female Earnings Comparison
Immigrants from Zaire
Sierra Leoneans
$36,017
MEDIAN FEMALE EARNINGS
0.0/ 100
METRIC RATING
288th/ 347
METRIC RANK
$42,868
MEDIAN FEMALE EARNINGS
99.9/ 100
METRIC RATING
65th/ 347
METRIC RANK
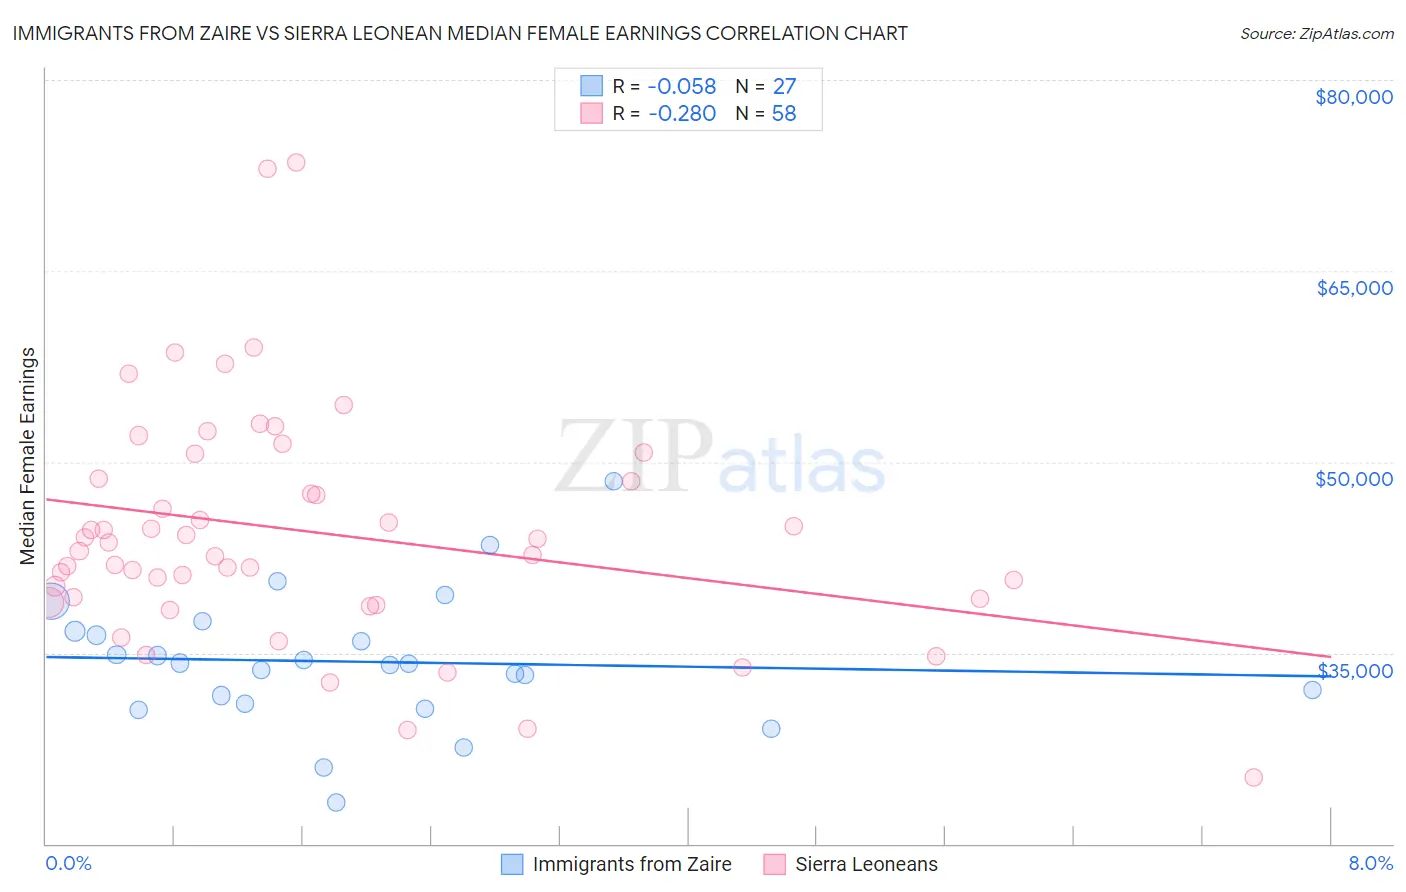
Immigrants from Zaire vs Sierra Leonean Median Female Earnings Correlation Chart
The statistical analysis conducted on geographies consisting of 107,241,232 people shows a slight negative correlation between the proportion of Immigrants from Zaire and median female earnings in the United States with a correlation coefficient (R) of -0.058 and weighted average of $36,017. Similarly, the statistical analysis conducted on geographies consisting of 83,345,835 people shows a weak negative correlation between the proportion of Sierra Leoneans and median female earnings in the United States with a correlation coefficient (R) of -0.280 and weighted average of $42,868, a difference of 19.0%.
Median Female Earnings Correlation Summary
| Measurement | Immigrants from Zaire | Sierra Leonean |
| Minimum | $23,286 | $25,167 |
| Maximum | $48,487 | $73,523 |
| Range | $25,201 | $48,356 |
| Mean | $34,296 | $44,483 |
| Median | $34,189 | $43,304 |
| Interquartile 25% (IQ1) | $30,969 | $39,290 |
| Interquartile 75% (IQ3) | $36,705 | $48,705 |
| Interquartile Range (IQR) | $5,736 | $9,415 |
| Standard Deviation (Sample) | $5,243 | $9,174 |
| Standard Deviation (Population) | $5,145 | $9,094 |
Similar Demographics by Median Female Earnings
Demographics Similar to Immigrants from Zaire by Median Female Earnings
In terms of median female earnings, the demographic groups most similar to Immigrants from Zaire are Immigrants from Nicaragua ($36,023, a difference of 0.020%), Osage ($36,034, a difference of 0.050%), Paiute ($36,056, a difference of 0.11%), Bangladeshi ($35,960, a difference of 0.16%), and Central American Indian ($35,930, a difference of 0.24%).
| Demographics | Rating | Rank | Median Female Earnings |
| Spanish Americans | 0.1 /100 | #281 | Tragic $36,391 |
| Haitians | 0.1 /100 | #282 | Tragic $36,374 |
| Immigrants | Haiti | 0.1 /100 | #283 | Tragic $36,203 |
| Indonesians | 0.1 /100 | #284 | Tragic $36,140 |
| Paiute | 0.1 /100 | #285 | Tragic $36,056 |
| Osage | 0.0 /100 | #286 | Tragic $36,034 |
| Immigrants | Nicaragua | 0.0 /100 | #287 | Tragic $36,023 |
| Immigrants | Zaire | 0.0 /100 | #288 | Tragic $36,017 |
| Bangladeshis | 0.0 /100 | #289 | Tragic $35,960 |
| Central American Indians | 0.0 /100 | #290 | Tragic $35,930 |
| Blackfeet | 0.0 /100 | #291 | Tragic $35,864 |
| Americans | 0.0 /100 | #292 | Tragic $35,777 |
| Guatemalans | 0.0 /100 | #293 | Tragic $35,695 |
| Cheyenne | 0.0 /100 | #294 | Tragic $35,673 |
| Comanche | 0.0 /100 | #295 | Tragic $35,661 |
Demographics Similar to Sierra Leoneans by Median Female Earnings
In terms of median female earnings, the demographic groups most similar to Sierra Leoneans are Immigrants from Norway ($42,837, a difference of 0.070%), Immigrants from Egypt ($42,837, a difference of 0.070%), Immigrants from Austria ($42,824, a difference of 0.10%), Immigrants from Spain ($42,815, a difference of 0.12%), and Immigrants from Ethiopia ($42,744, a difference of 0.29%).
| Demographics | Rating | Rank | Median Female Earnings |
| Paraguayans | 99.9 /100 | #58 | Exceptional $43,173 |
| Estonians | 99.9 /100 | #59 | Exceptional $43,106 |
| Immigrants | Latvia | 99.9 /100 | #60 | Exceptional $43,099 |
| Immigrants | Bulgaria | 99.9 /100 | #61 | Exceptional $43,085 |
| Afghans | 99.9 /100 | #62 | Exceptional $43,077 |
| Immigrants | Ukraine | 99.9 /100 | #63 | Exceptional $43,069 |
| Immigrants | Pakistan | 99.9 /100 | #64 | Exceptional $43,052 |
| Sierra Leoneans | 99.9 /100 | #65 | Exceptional $42,868 |
| Immigrants | Norway | 99.9 /100 | #66 | Exceptional $42,837 |
| Immigrants | Egypt | 99.9 /100 | #67 | Exceptional $42,837 |
| Immigrants | Austria | 99.8 /100 | #68 | Exceptional $42,824 |
| Immigrants | Spain | 99.8 /100 | #69 | Exceptional $42,815 |
| Immigrants | Ethiopia | 99.8 /100 | #70 | Exceptional $42,744 |
| Immigrants | Romania | 99.8 /100 | #71 | Exceptional $42,718 |
| Albanians | 99.8 /100 | #72 | Exceptional $42,584 |