Immigrants from Turkey vs Lebanese Median Earnings
COMPARE
Immigrants from Turkey
Lebanese
Median Earnings
Median Earnings Comparison
Immigrants from Turkey
Lebanese
$52,960
MEDIAN EARNINGS
100.0/ 100
METRIC RATING
39th/ 347
METRIC RANK
$48,226
MEDIAN EARNINGS
92.5/ 100
METRIC RATING
131st/ 347
METRIC RANK
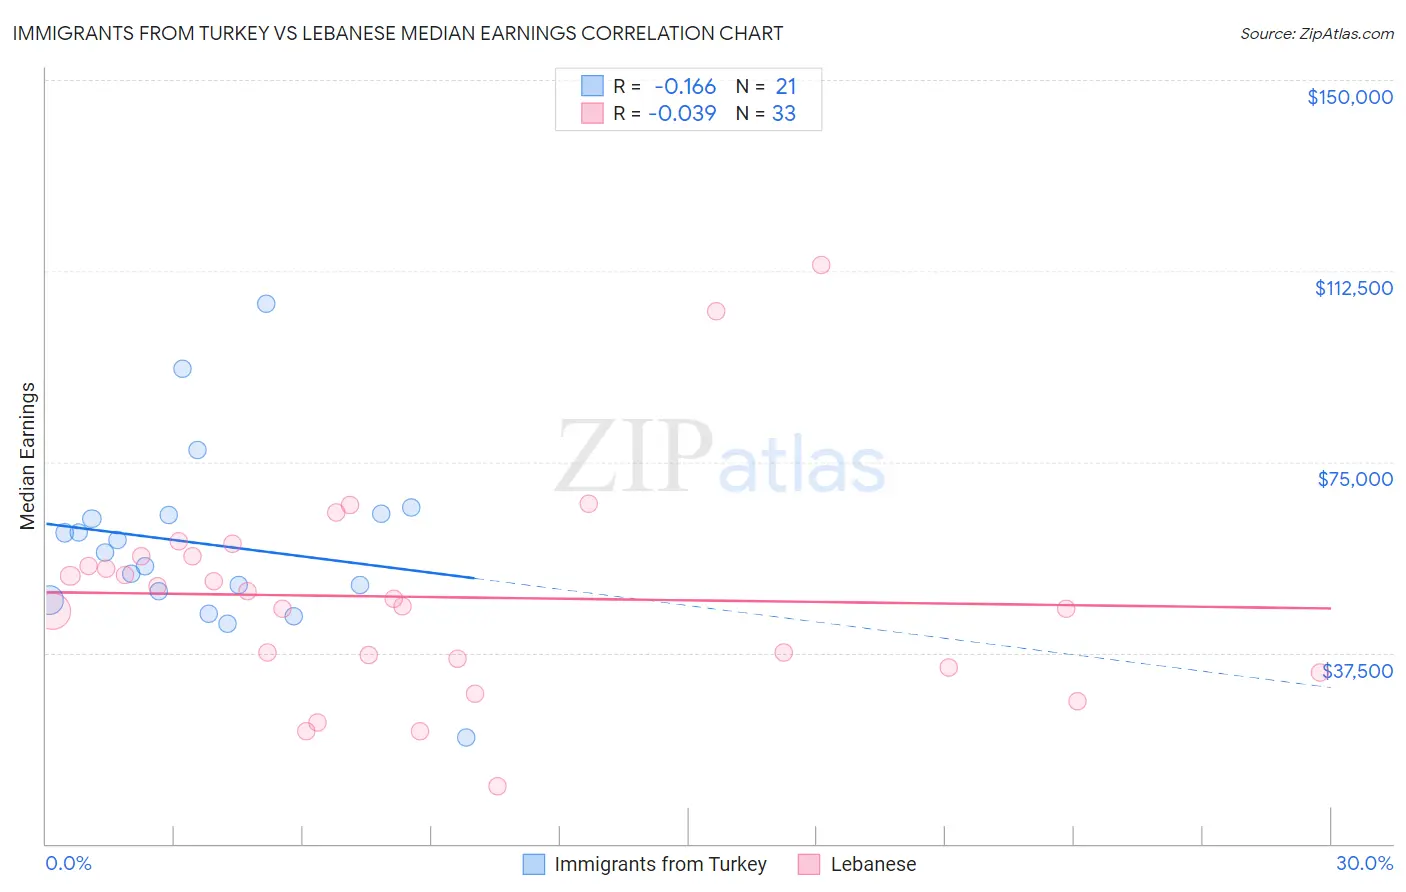
Immigrants from Turkey vs Lebanese Median Earnings Correlation Chart
The statistical analysis conducted on geographies consisting of 223,042,474 people shows a poor negative correlation between the proportion of Immigrants from Turkey and median earnings in the United States with a correlation coefficient (R) of -0.166 and weighted average of $52,960. Similarly, the statistical analysis conducted on geographies consisting of 401,606,109 people shows no correlation between the proportion of Lebanese and median earnings in the United States with a correlation coefficient (R) of -0.039 and weighted average of $48,226, a difference of 9.8%.
Median Earnings Correlation Summary
| Measurement | Immigrants from Turkey | Lebanese |
| Minimum | $20,750 | $11,384 |
| Maximum | $106,061 | $113,646 |
| Range | $85,311 | $102,262 |
| Mean | $58,831 | $48,478 |
| Median | $57,227 | $48,125 |
| Interquartile 25% (IQ1) | $48,717 | $35,416 |
| Interquartile 75% (IQ3) | $64,687 | $56,506 |
| Interquartile Range (IQR) | $15,970 | $21,090 |
| Standard Deviation (Sample) | $17,879 | $20,869 |
| Standard Deviation (Population) | $17,448 | $20,550 |
Similar Demographics by Median Earnings
Demographics Similar to Immigrants from Turkey by Median Earnings
In terms of median earnings, the demographic groups most similar to Immigrants from Turkey are Israeli ($52,937, a difference of 0.040%), Latvian ($53,001, a difference of 0.080%), Immigrants from Belarus ($53,043, a difference of 0.16%), Immigrants from Lithuania ($52,769, a difference of 0.36%), and Immigrants from Denmark ($53,186, a difference of 0.43%).
| Demographics | Rating | Rank | Median Earnings |
| Immigrants | Asia | 100.0 /100 | #32 | Exceptional $53,310 |
| Immigrants | Greece | 100.0 /100 | #33 | Exceptional $53,282 |
| Immigrants | Sri Lanka | 100.0 /100 | #34 | Exceptional $53,268 |
| Immigrants | Switzerland | 100.0 /100 | #35 | Exceptional $53,211 |
| Immigrants | Denmark | 100.0 /100 | #36 | Exceptional $53,186 |
| Immigrants | Belarus | 100.0 /100 | #37 | Exceptional $53,043 |
| Latvians | 100.0 /100 | #38 | Exceptional $53,001 |
| Immigrants | Turkey | 100.0 /100 | #39 | Exceptional $52,960 |
| Israelis | 100.0 /100 | #40 | Exceptional $52,937 |
| Immigrants | Lithuania | 100.0 /100 | #41 | Exceptional $52,769 |
| Maltese | 100.0 /100 | #42 | Exceptional $52,526 |
| Immigrants | Malaysia | 100.0 /100 | #43 | Exceptional $52,514 |
| Bulgarians | 100.0 /100 | #44 | Exceptional $52,512 |
| Immigrants | Czechoslovakia | 100.0 /100 | #45 | Exceptional $52,361 |
| Bhutanese | 100.0 /100 | #46 | Exceptional $52,297 |
Demographics Similar to Lebanese by Median Earnings
In terms of median earnings, the demographic groups most similar to Lebanese are Zimbabwean ($48,229, a difference of 0.010%), Pakistani ($48,254, a difference of 0.060%), Immigrants from Philippines ($48,266, a difference of 0.080%), British ($48,189, a difference of 0.080%), and Sierra Leonean ($48,286, a difference of 0.12%).
| Demographics | Rating | Rank | Median Earnings |
| Brazilians | 93.7 /100 | #124 | Exceptional $48,356 |
| Immigrants | Fiji | 93.3 /100 | #125 | Exceptional $48,305 |
| Assyrians/Chaldeans/Syriacs | 93.3 /100 | #126 | Exceptional $48,304 |
| Sierra Leoneans | 93.1 /100 | #127 | Exceptional $48,286 |
| Immigrants | Philippines | 92.9 /100 | #128 | Exceptional $48,266 |
| Pakistanis | 92.8 /100 | #129 | Exceptional $48,254 |
| Zimbabweans | 92.6 /100 | #130 | Exceptional $48,229 |
| Lebanese | 92.5 /100 | #131 | Exceptional $48,226 |
| British | 92.2 /100 | #132 | Exceptional $48,189 |
| Immigrants | Uganda | 90.5 /100 | #133 | Exceptional $48,041 |
| Sri Lankans | 90.5 /100 | #134 | Exceptional $48,040 |
| Portuguese | 90.4 /100 | #135 | Exceptional $48,032 |
| Slovenes | 90.0 /100 | #136 | Excellent $47,995 |
| Immigrants | Nepal | 89.0 /100 | #137 | Excellent $47,925 |
| Europeans | 88.9 /100 | #138 | Excellent $47,915 |