Immigrants from Western Africa vs Immigrants from Cabo Verde Median Male Earnings
COMPARE
Immigrants from Western Africa
Immigrants from Cabo Verde
Median Male Earnings
Median Male Earnings Comparison
Immigrants from Western Africa
Immigrants from Cabo Verde
$50,940
MEDIAN MALE EARNINGS
3.0/ 100
METRIC RATING
235th/ 347
METRIC RANK
$50,009
MEDIAN MALE EARNINGS
1.2/ 100
METRIC RATING
252nd/ 347
METRIC RANK
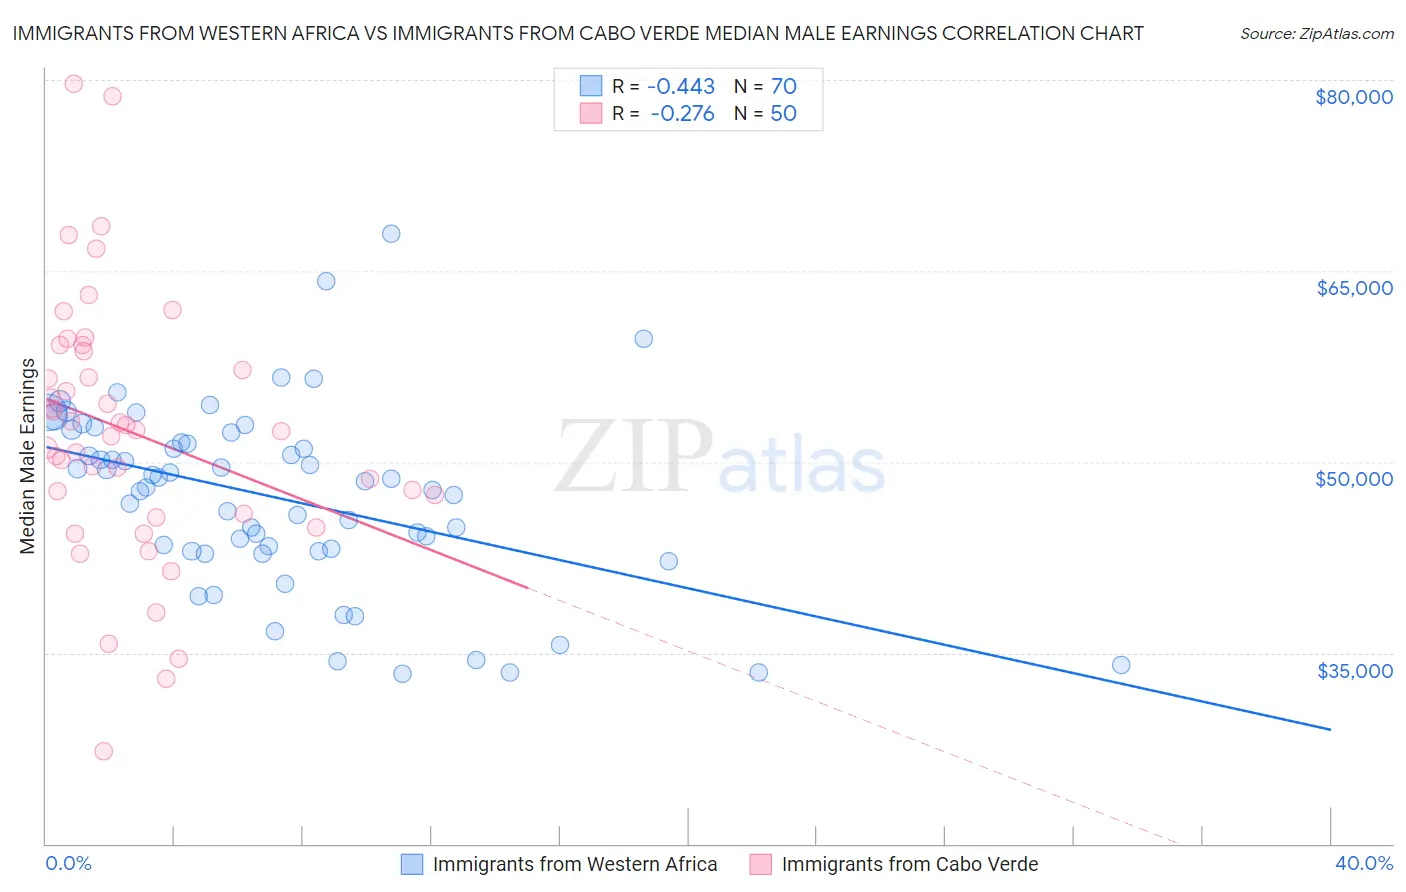
Immigrants from Western Africa vs Immigrants from Cabo Verde Median Male Earnings Correlation Chart
The statistical analysis conducted on geographies consisting of 357,835,205 people shows a moderate negative correlation between the proportion of Immigrants from Western Africa and median male earnings in the United States with a correlation coefficient (R) of -0.443 and weighted average of $50,940. Similarly, the statistical analysis conducted on geographies consisting of 38,152,357 people shows a weak negative correlation between the proportion of Immigrants from Cabo Verde and median male earnings in the United States with a correlation coefficient (R) of -0.276 and weighted average of $50,009, a difference of 1.9%.
Median Male Earnings Correlation Summary
| Measurement | Immigrants from Western Africa | Immigrants from Cabo Verde |
| Minimum | $33,371 | $27,292 |
| Maximum | $67,960 | $79,684 |
| Range | $34,589 | $52,392 |
| Mean | $47,183 | $52,373 |
| Median | $48,227 | $52,422 |
| Interquartile 25% (IQ1) | $42,968 | $45,929 |
| Interquartile 75% (IQ3) | $51,502 | $58,666 |
| Interquartile Range (IQR) | $8,534 | $12,737 |
| Standard Deviation (Sample) | $7,172 | $10,362 |
| Standard Deviation (Population) | $7,120 | $10,258 |
Demographics Similar to Immigrants from Western Africa and Immigrants from Cabo Verde by Median Male Earnings
In terms of median male earnings, the demographic groups most similar to Immigrants from Western Africa are Pennsylvania German ($50,878, a difference of 0.12%), Immigrants from Barbados ($50,795, a difference of 0.28%), Cape Verdean ($51,103, a difference of 0.32%), Malaysian ($50,772, a difference of 0.33%), and American ($50,761, a difference of 0.35%). Similarly, the demographic groups most similar to Immigrants from Cabo Verde are German Russian ($49,924, a difference of 0.17%), Immigrants from Grenada ($50,279, a difference of 0.54%), Osage ($50,292, a difference of 0.57%), Immigrants from Burma/Myanmar ($50,298, a difference of 0.58%), and Immigrants from Guyana ($50,321, a difference of 0.63%).
| Demographics | Rating | Rank | Median Male Earnings |
| Aleuts | 3.7 /100 | #233 | Tragic $51,168 |
| Cape Verdeans | 3.5 /100 | #234 | Tragic $51,103 |
| Immigrants | Western Africa | 3.0 /100 | #235 | Tragic $50,940 |
| Pennsylvania Germans | 2.8 /100 | #236 | Tragic $50,878 |
| Immigrants | Barbados | 2.6 /100 | #237 | Tragic $50,795 |
| Malaysians | 2.5 /100 | #238 | Tragic $50,772 |
| Americans | 2.5 /100 | #239 | Tragic $50,761 |
| West Indians | 2.3 /100 | #240 | Tragic $50,682 |
| Immigrants | St. Vincent and the Grenadines | 2.3 /100 | #241 | Tragic $50,665 |
| Guyanese | 2.2 /100 | #242 | Tragic $50,613 |
| French American Indians | 2.2 /100 | #243 | Tragic $50,611 |
| Houma | 2.0 /100 | #244 | Tragic $50,547 |
| Hawaiians | 1.9 /100 | #245 | Tragic $50,488 |
| Immigrants | Ecuador | 1.9 /100 | #246 | Tragic $50,474 |
| Sub-Saharan Africans | 1.8 /100 | #247 | Tragic $50,408 |
| Immigrants | Guyana | 1.6 /100 | #248 | Tragic $50,321 |
| Immigrants | Burma/Myanmar | 1.6 /100 | #249 | Tragic $50,298 |
| Osage | 1.6 /100 | #250 | Tragic $50,292 |
| Immigrants | Grenada | 1.6 /100 | #251 | Tragic $50,279 |
| Immigrants | Cabo Verde | 1.2 /100 | #252 | Tragic $50,009 |
| German Russians | 1.1 /100 | #253 | Tragic $49,924 |