Immigrants from Laos vs Immigrants from Austria Median Female Earnings
COMPARE
Immigrants from Laos
Immigrants from Austria
Median Female Earnings
Median Female Earnings Comparison
Immigrants from Laos
Immigrants from Austria
$36,841
MEDIAN FEMALE EARNINGS
0.3/ 100
METRIC RATING
273rd/ 347
METRIC RANK
$42,824
MEDIAN FEMALE EARNINGS
99.8/ 100
METRIC RATING
68th/ 347
METRIC RANK
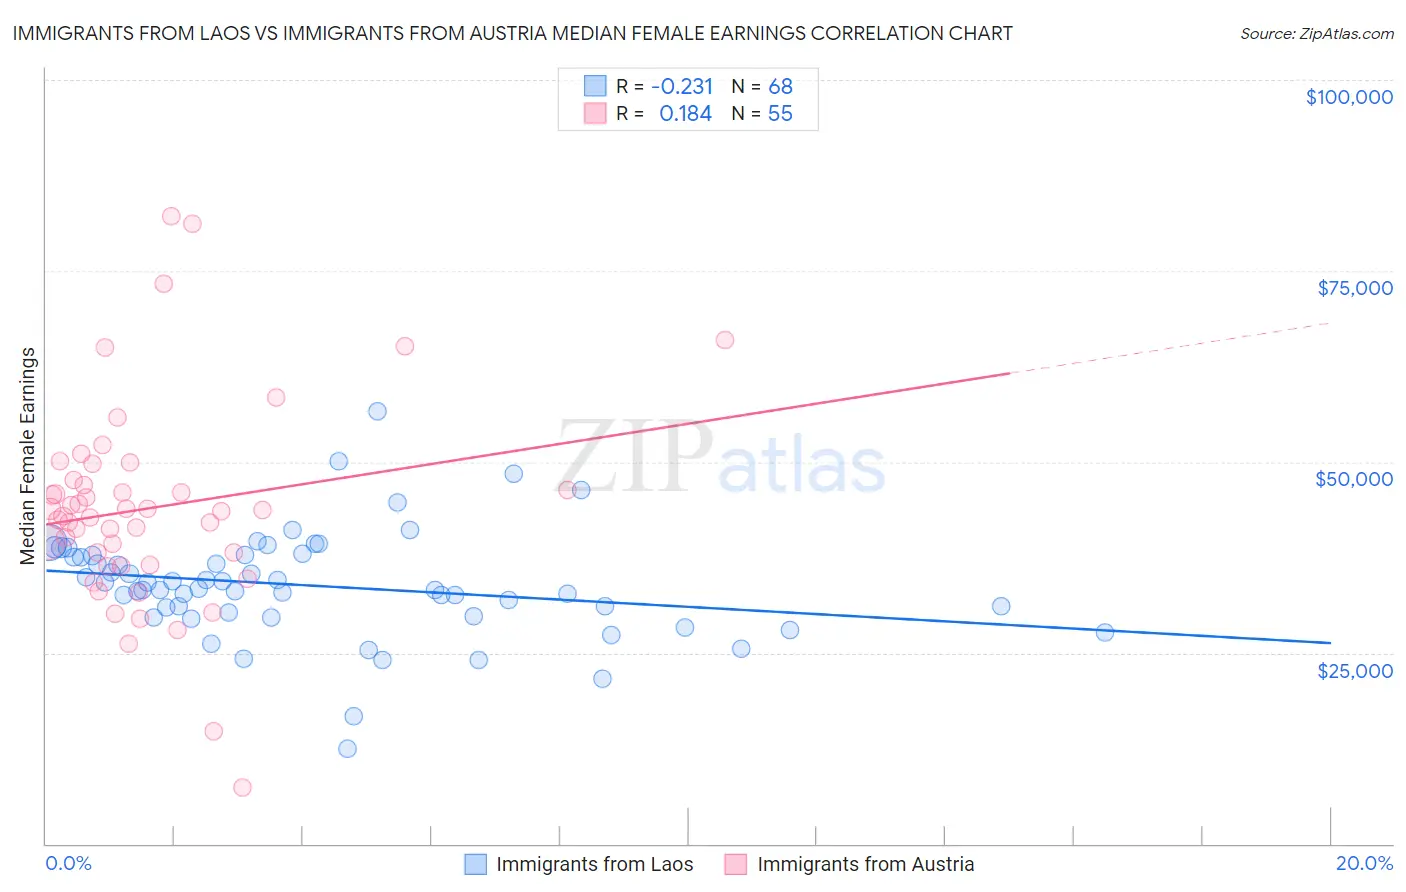
Immigrants from Laos vs Immigrants from Austria Median Female Earnings Correlation Chart
The statistical analysis conducted on geographies consisting of 201,447,053 people shows a weak negative correlation between the proportion of Immigrants from Laos and median female earnings in the United States with a correlation coefficient (R) of -0.231 and weighted average of $36,841. Similarly, the statistical analysis conducted on geographies consisting of 167,926,482 people shows a poor positive correlation between the proportion of Immigrants from Austria and median female earnings in the United States with a correlation coefficient (R) of 0.184 and weighted average of $42,824, a difference of 16.2%.
Median Female Earnings Correlation Summary
| Measurement | Immigrants from Laos | Immigrants from Austria |
| Minimum | $12,451 | $7,363 |
| Maximum | $56,635 | $82,240 |
| Range | $44,184 | $74,877 |
| Mean | $33,796 | $43,980 |
| Median | $33,308 | $43,611 |
| Interquartile 25% (IQ1) | $29,977 | $36,503 |
| Interquartile 75% (IQ3) | $37,781 | $47,678 |
| Interquartile Range (IQR) | $7,803 | $11,175 |
| Standard Deviation (Sample) | $7,087 | $13,481 |
| Standard Deviation (Population) | $7,035 | $13,358 |
Similar Demographics by Median Female Earnings
Demographics Similar to Immigrants from Laos by Median Female Earnings
In terms of median female earnings, the demographic groups most similar to Immigrants from Laos are Immigrants from Dominican Republic ($36,857, a difference of 0.040%), Nicaraguan ($36,904, a difference of 0.17%), French American Indian ($36,920, a difference of 0.21%), Immigrants from Venezuela ($37,003, a difference of 0.44%), and Immigrants from El Salvador ($36,673, a difference of 0.46%).
| Demographics | Rating | Rank | Median Female Earnings |
| Dominicans | 0.4 /100 | #266 | Tragic $37,046 |
| Immigrants | Nonimmigrants | 0.4 /100 | #267 | Tragic $37,024 |
| Cree | 0.4 /100 | #268 | Tragic $37,018 |
| Immigrants | Venezuela | 0.4 /100 | #269 | Tragic $37,003 |
| French American Indians | 0.3 /100 | #270 | Tragic $36,920 |
| Nicaraguans | 0.3 /100 | #271 | Tragic $36,904 |
| Immigrants | Dominican Republic | 0.3 /100 | #272 | Tragic $36,857 |
| Immigrants | Laos | 0.3 /100 | #273 | Tragic $36,841 |
| Immigrants | El Salvador | 0.2 /100 | #274 | Tragic $36,673 |
| Africans | 0.1 /100 | #275 | Tragic $36,530 |
| Central Americans | 0.1 /100 | #276 | Tragic $36,492 |
| Marshallese | 0.1 /100 | #277 | Tragic $36,459 |
| U.S. Virgin Islanders | 0.1 /100 | #278 | Tragic $36,424 |
| Immigrants | Caribbean | 0.1 /100 | #279 | Tragic $36,414 |
| Iroquois | 0.1 /100 | #280 | Tragic $36,408 |
Demographics Similar to Immigrants from Austria by Median Female Earnings
In terms of median female earnings, the demographic groups most similar to Immigrants from Austria are Immigrants from Spain ($42,815, a difference of 0.020%), Immigrants from Norway ($42,837, a difference of 0.030%), Immigrants from Egypt ($42,837, a difference of 0.030%), Sierra Leonean ($42,868, a difference of 0.10%), and Immigrants from Ethiopia ($42,744, a difference of 0.19%).
| Demographics | Rating | Rank | Median Female Earnings |
| Immigrants | Bulgaria | 99.9 /100 | #61 | Exceptional $43,085 |
| Afghans | 99.9 /100 | #62 | Exceptional $43,077 |
| Immigrants | Ukraine | 99.9 /100 | #63 | Exceptional $43,069 |
| Immigrants | Pakistan | 99.9 /100 | #64 | Exceptional $43,052 |
| Sierra Leoneans | 99.9 /100 | #65 | Exceptional $42,868 |
| Immigrants | Norway | 99.9 /100 | #66 | Exceptional $42,837 |
| Immigrants | Egypt | 99.9 /100 | #67 | Exceptional $42,837 |
| Immigrants | Austria | 99.8 /100 | #68 | Exceptional $42,824 |
| Immigrants | Spain | 99.8 /100 | #69 | Exceptional $42,815 |
| Immigrants | Ethiopia | 99.8 /100 | #70 | Exceptional $42,744 |
| Immigrants | Romania | 99.8 /100 | #71 | Exceptional $42,718 |
| Albanians | 99.8 /100 | #72 | Exceptional $42,584 |
| Mongolians | 99.7 /100 | #73 | Exceptional $42,542 |
| Immigrants | South Africa | 99.7 /100 | #74 | Exceptional $42,508 |
| New Zealanders | 99.7 /100 | #75 | Exceptional $42,446 |