Bulgarian vs Iraqi Householder Income Under 25 years
COMPARE
Bulgarian
Iraqi
Householder Income Under 25 years
Householder Income Under 25 years Comparison
Bulgarians
Iraqis
$54,352
HOUSEHOLDER INCOME UNDER 25 YEARS
99.5/ 100
METRIC RATING
84th/ 347
METRIC RANK
$50,802
HOUSEHOLDER INCOME UNDER 25 YEARS
3.2/ 100
METRIC RATING
238th/ 347
METRIC RANK
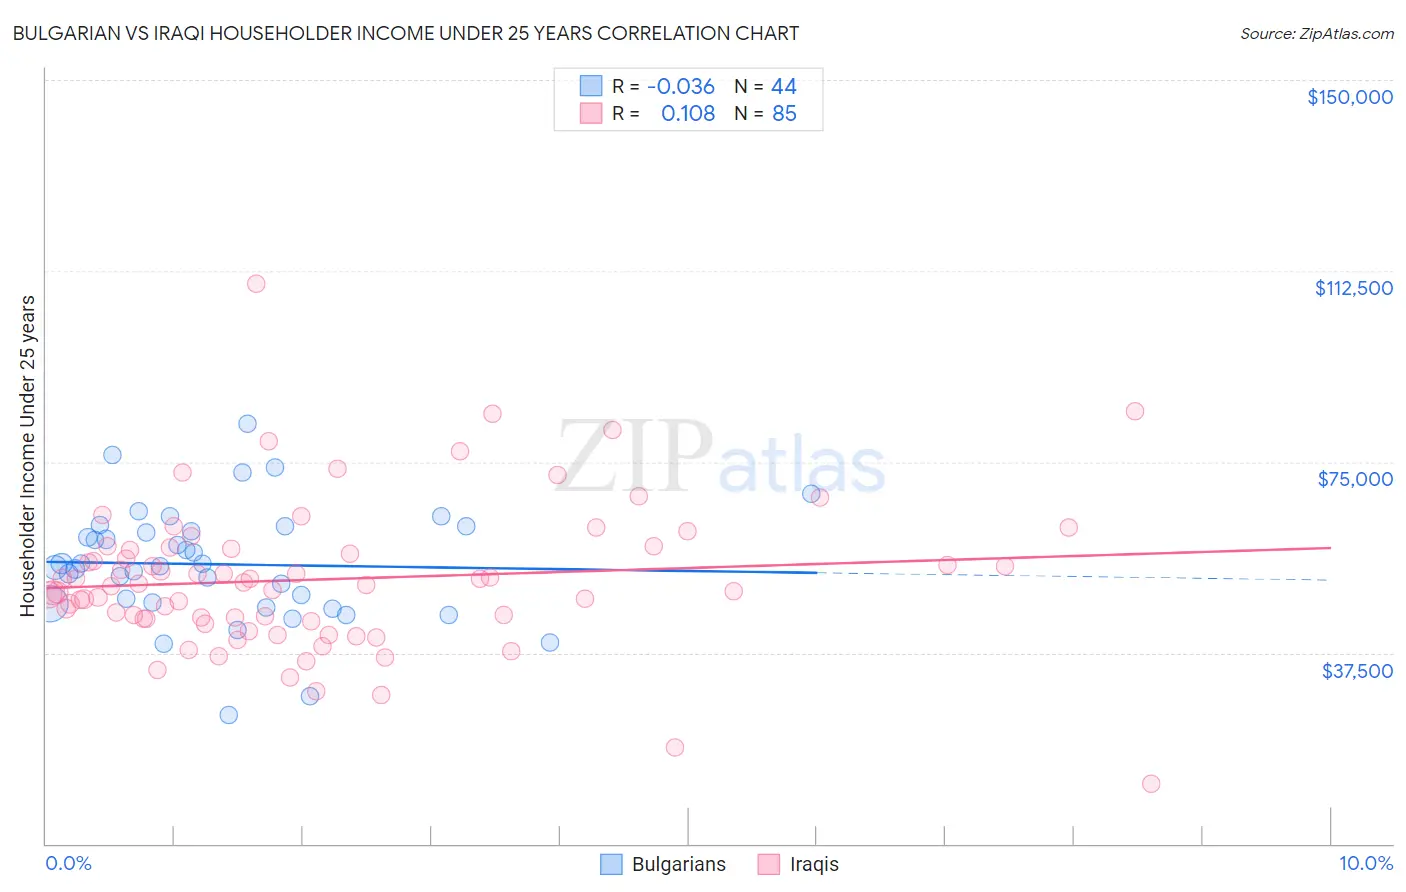
Bulgarian vs Iraqi Householder Income Under 25 years Correlation Chart
The statistical analysis conducted on geographies consisting of 184,447,475 people shows no correlation between the proportion of Bulgarians and household income with householder under the age of 25 in the United States with a correlation coefficient (R) of -0.036 and weighted average of $54,352. Similarly, the statistical analysis conducted on geographies consisting of 156,411,431 people shows a poor positive correlation between the proportion of Iraqis and household income with householder under the age of 25 in the United States with a correlation coefficient (R) of 0.108 and weighted average of $50,802, a difference of 7.0%.
Householder Income Under 25 years Correlation Summary
| Measurement | Bulgarian | Iraqi |
| Minimum | $25,208 | $11,835 |
| Maximum | $82,576 | $109,885 |
| Range | $57,368 | $98,050 |
| Mean | $54,870 | $51,943 |
| Median | $54,743 | $50,714 |
| Interquartile 25% (IQ1) | $47,263 | $44,189 |
| Interquartile 75% (IQ3) | $61,883 | $58,150 |
| Interquartile Range (IQR) | $14,621 | $13,961 |
| Standard Deviation (Sample) | $11,464 | $14,592 |
| Standard Deviation (Population) | $11,333 | $14,506 |
Similar Demographics by Householder Income Under 25 years
Demographics Similar to Bulgarians by Householder Income Under 25 years
In terms of householder income under 25 years, the demographic groups most similar to Bulgarians are Immigrants from Czechoslovakia ($54,352, a difference of 0.0%), Immigrants from Croatia ($54,343, a difference of 0.020%), Laotian ($54,369, a difference of 0.030%), Brazilian ($54,335, a difference of 0.030%), and Yakama ($54,321, a difference of 0.060%).
| Demographics | Rating | Rank | Householder Income Under 25 years |
| Immigrants | Southern Europe | 99.6 /100 | #77 | Exceptional $54,484 |
| Nepalese | 99.6 /100 | #78 | Exceptional $54,472 |
| Immigrants | Italy | 99.6 /100 | #79 | Exceptional $54,449 |
| Egyptians | 99.6 /100 | #80 | Exceptional $54,444 |
| Portuguese | 99.6 /100 | #81 | Exceptional $54,436 |
| Russians | 99.5 /100 | #82 | Exceptional $54,389 |
| Laotians | 99.5 /100 | #83 | Exceptional $54,369 |
| Bulgarians | 99.5 /100 | #84 | Exceptional $54,352 |
| Immigrants | Czechoslovakia | 99.5 /100 | #85 | Exceptional $54,352 |
| Immigrants | Croatia | 99.5 /100 | #86 | Exceptional $54,343 |
| Brazilians | 99.5 /100 | #87 | Exceptional $54,335 |
| Yakama | 99.5 /100 | #88 | Exceptional $54,321 |
| Immigrants | South America | 99.4 /100 | #89 | Exceptional $54,268 |
| Turks | 99.4 /100 | #90 | Exceptional $54,266 |
| Immigrants | Egypt | 99.3 /100 | #91 | Exceptional $54,239 |
Demographics Similar to Iraqis by Householder Income Under 25 years
In terms of householder income under 25 years, the demographic groups most similar to Iraqis are German ($50,804, a difference of 0.0%), English ($50,805, a difference of 0.010%), Spanish ($50,813, a difference of 0.020%), Kenyan ($50,815, a difference of 0.030%), and Immigrants from Caribbean ($50,757, a difference of 0.090%).
| Demographics | Rating | Rank | Householder Income Under 25 years |
| Ugandans | 4.3 /100 | #231 | Tragic $50,923 |
| Slovenes | 4.0 /100 | #232 | Tragic $50,886 |
| Pennsylvania Germans | 3.7 /100 | #233 | Tragic $50,852 |
| Kenyans | 3.3 /100 | #234 | Tragic $50,815 |
| Spanish | 3.3 /100 | #235 | Tragic $50,813 |
| English | 3.3 /100 | #236 | Tragic $50,805 |
| Germans | 3.3 /100 | #237 | Tragic $50,804 |
| Iraqis | 3.2 /100 | #238 | Tragic $50,802 |
| Immigrants | Caribbean | 2.9 /100 | #239 | Tragic $50,757 |
| Immigrants | Lebanon | 2.7 /100 | #240 | Tragic $50,729 |
| Immigrants | Micronesia | 2.5 /100 | #241 | Tragic $50,691 |
| Cubans | 2.3 /100 | #242 | Tragic $50,655 |
| Immigrants | Thailand | 2.2 /100 | #243 | Tragic $50,645 |
| Marshallese | 2.1 /100 | #244 | Tragic $50,627 |
| Immigrants | Africa | 2.0 /100 | #245 | Tragic $50,609 |