Lebanese vs Mexican Householder Income Under 25 years
COMPARE
Lebanese
Mexican
Householder Income Under 25 years
Householder Income Under 25 years Comparison
Lebanese
Mexicans
$50,355
HOUSEHOLDER INCOME UNDER 25 YEARS
1.1/ 100
METRIC RATING
257th/ 347
METRIC RANK
$49,989
HOUSEHOLDER INCOME UNDER 25 YEARS
0.5/ 100
METRIC RATING
270th/ 347
METRIC RANK
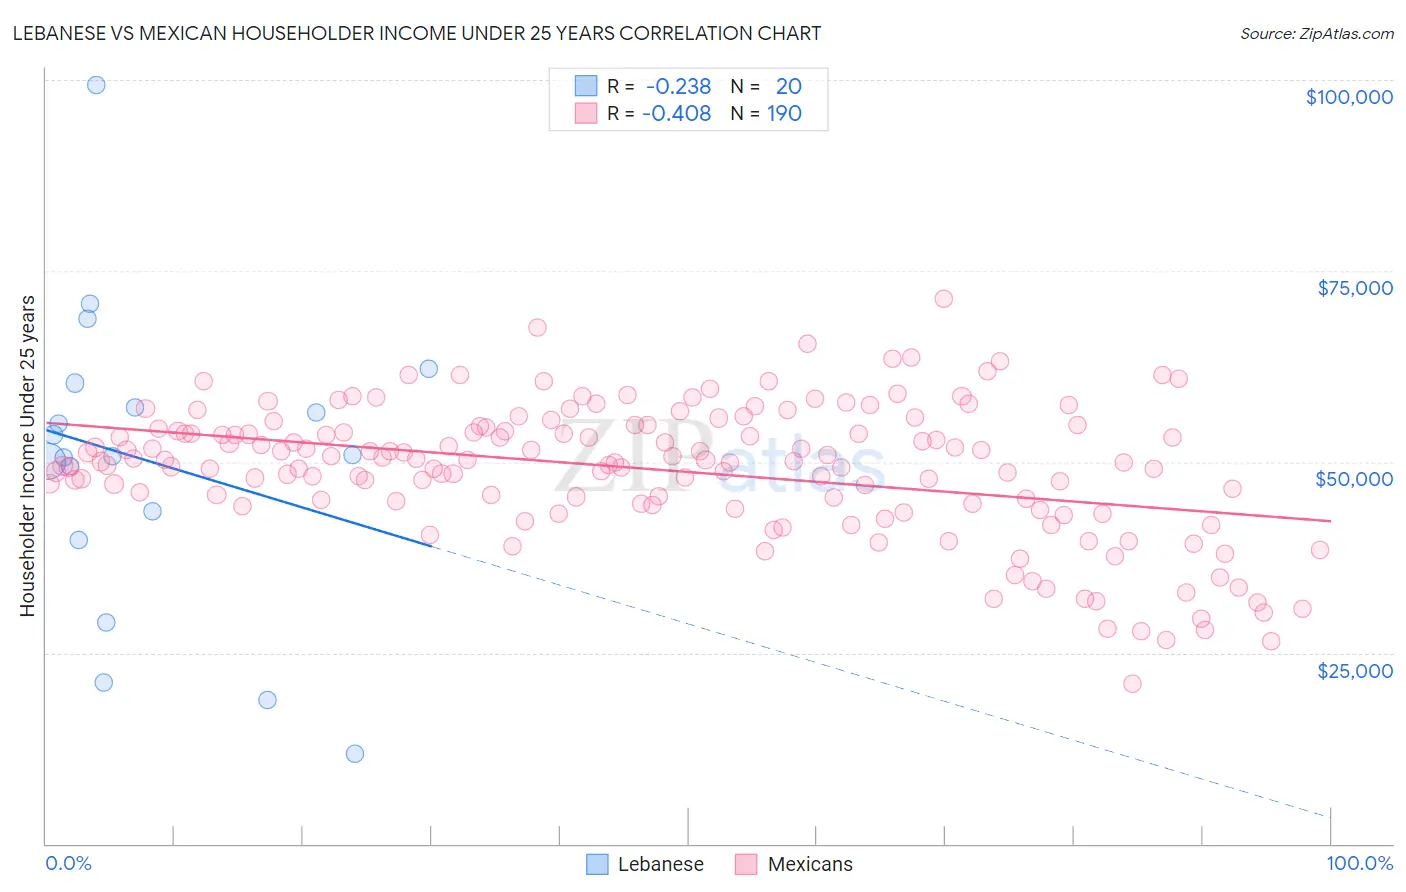
Lebanese vs Mexican Householder Income Under 25 years Correlation Chart
The statistical analysis conducted on geographies consisting of 337,299,986 people shows a weak negative correlation between the proportion of Lebanese and household income with householder under the age of 25 in the United States with a correlation coefficient (R) of -0.238 and weighted average of $50,355. Similarly, the statistical analysis conducted on geographies consisting of 438,958,385 people shows a moderate negative correlation between the proportion of Mexicans and household income with householder under the age of 25 in the United States with a correlation coefficient (R) of -0.408 and weighted average of $49,989, a difference of 0.73%.
Householder Income Under 25 years Correlation Summary
| Measurement | Lebanese | Mexican |
| Minimum | $11,835 | $20,927 |
| Maximum | $99,421 | $71,283 |
| Range | $87,586 | $50,356 |
| Mean | $49,958 | $48,982 |
| Median | $50,777 | $50,141 |
| Interquartile 25% (IQ1) | $41,651 | $44,588 |
| Interquartile 75% (IQ3) | $58,726 | $54,345 |
| Interquartile Range (IQR) | $17,075 | $9,757 |
| Standard Deviation (Sample) | $19,834 | $8,735 |
| Standard Deviation (Population) | $19,332 | $8,712 |
Demographics Similar to Lebanese and Mexicans by Householder Income Under 25 years
In terms of householder income under 25 years, the demographic groups most similar to Lebanese are Aleut ($50,377, a difference of 0.040%), Immigrants from Cuba ($50,374, a difference of 0.040%), White/Caucasian ($50,336, a difference of 0.040%), Luxembourger ($50,379, a difference of 0.050%), and Immigrants from Haiti ($50,398, a difference of 0.090%). Similarly, the demographic groups most similar to Mexicans are Ute ($49,997, a difference of 0.010%), Venezuelan ($50,011, a difference of 0.040%), Immigrants from Laos ($50,041, a difference of 0.10%), Immigrants from Venezuela ($50,109, a difference of 0.24%), and Belgian ($50,113, a difference of 0.25%).
| Demographics | Rating | Rank | Householder Income Under 25 years |
| Immigrants | Haiti | 1.2 /100 | #253 | Tragic $50,398 |
| Luxembourgers | 1.2 /100 | #254 | Tragic $50,379 |
| Aleuts | 1.2 /100 | #255 | Tragic $50,377 |
| Immigrants | Cuba | 1.2 /100 | #256 | Tragic $50,374 |
| Lebanese | 1.1 /100 | #257 | Tragic $50,355 |
| Whites/Caucasians | 1.1 /100 | #258 | Tragic $50,336 |
| Immigrants | Dominica | 1.0 /100 | #259 | Tragic $50,301 |
| Hispanics or Latinos | 0.9 /100 | #260 | Tragic $50,279 |
| Hungarians | 0.9 /100 | #261 | Tragic $50,247 |
| Haitians | 0.8 /100 | #262 | Tragic $50,231 |
| Immigrants | Dominican Republic | 0.8 /100 | #263 | Tragic $50,204 |
| Fijians | 0.6 /100 | #264 | Tragic $50,132 |
| Belgians | 0.6 /100 | #265 | Tragic $50,113 |
| Immigrants | Venezuela | 0.6 /100 | #266 | Tragic $50,109 |
| Immigrants | Laos | 0.5 /100 | #267 | Tragic $50,041 |
| Venezuelans | 0.5 /100 | #268 | Tragic $50,011 |
| Ute | 0.5 /100 | #269 | Tragic $49,997 |
| Mexicans | 0.5 /100 | #270 | Tragic $49,989 |
| Taiwanese | 0.3 /100 | #271 | Tragic $49,804 |
| Colville | 0.3 /100 | #272 | Tragic $49,774 |
| Slovaks | 0.3 /100 | #273 | Tragic $49,753 |