Lebanese vs Korean Median Earnings
COMPARE
Lebanese
Korean
Median Earnings
Median Earnings Comparison
Lebanese
Koreans
$48,226
MEDIAN EARNINGS
92.5/ 100
METRIC RATING
131st/ 347
METRIC RANK
$48,727
MEDIAN EARNINGS
96.2/ 100
METRIC RATING
116th/ 347
METRIC RANK
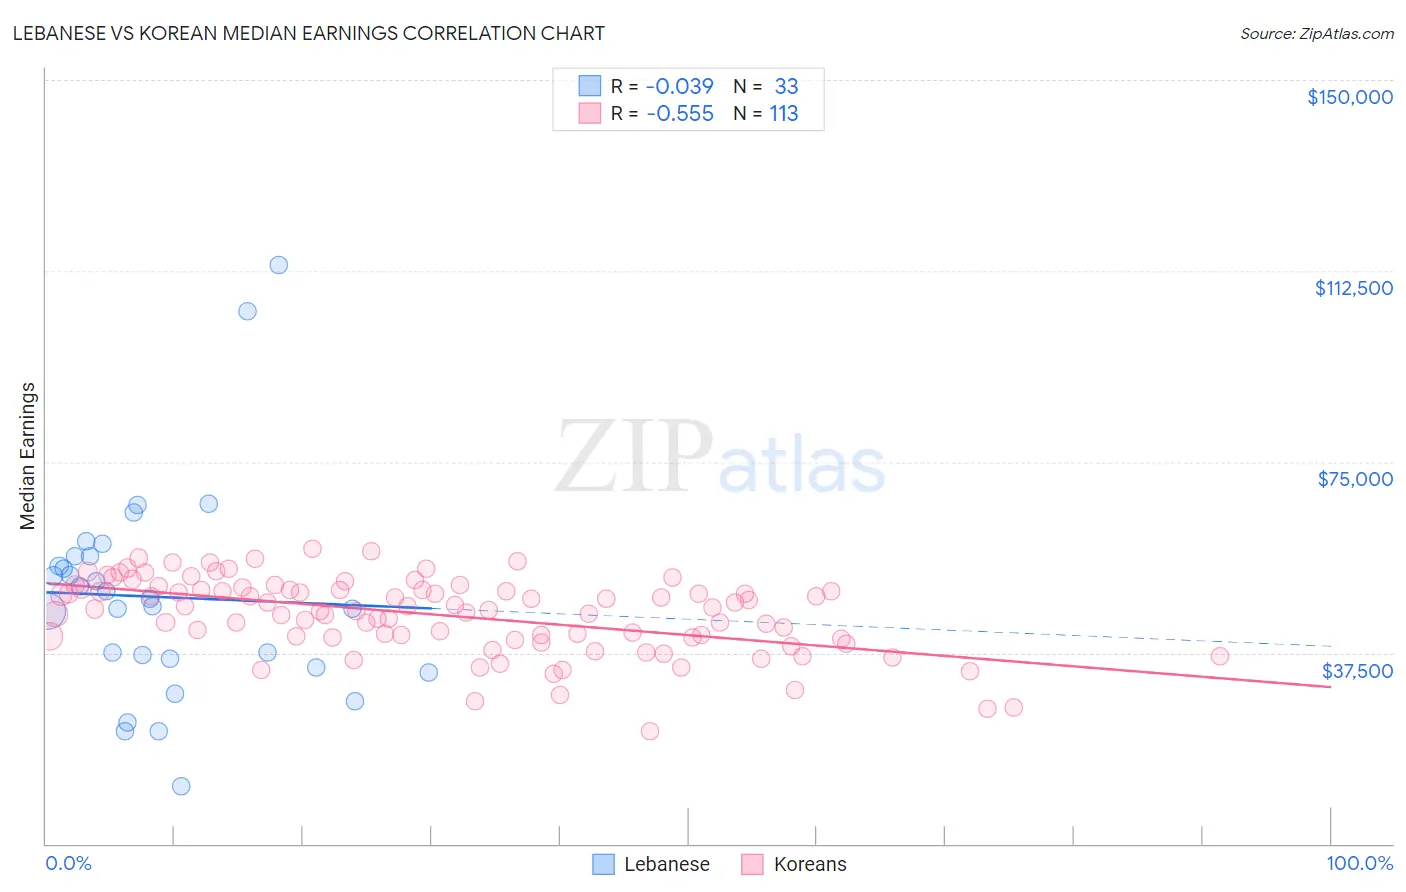
Lebanese vs Korean Median Earnings Correlation Chart
The statistical analysis conducted on geographies consisting of 401,606,109 people shows no correlation between the proportion of Lebanese and median earnings in the United States with a correlation coefficient (R) of -0.039 and weighted average of $48,226. Similarly, the statistical analysis conducted on geographies consisting of 510,900,863 people shows a substantial negative correlation between the proportion of Koreans and median earnings in the United States with a correlation coefficient (R) of -0.555 and weighted average of $48,727, a difference of 1.0%.
Median Earnings Correlation Summary
| Measurement | Lebanese | Korean |
| Minimum | $11,384 | $22,216 |
| Maximum | $113,646 | $57,875 |
| Range | $102,262 | $35,659 |
| Mean | $48,478 | $44,924 |
| Median | $48,125 | $46,110 |
| Interquartile 25% (IQ1) | $35,416 | $40,528 |
| Interquartile 75% (IQ3) | $56,506 | $49,935 |
| Interquartile Range (IQR) | $21,090 | $9,407 |
| Standard Deviation (Sample) | $20,869 | $7,353 |
| Standard Deviation (Population) | $20,550 | $7,320 |
Demographics Similar to Lebanese and Koreans by Median Earnings
In terms of median earnings, the demographic groups most similar to Lebanese are Zimbabwean ($48,229, a difference of 0.010%), Pakistani ($48,254, a difference of 0.060%), Immigrants from Philippines ($48,266, a difference of 0.080%), British ($48,189, a difference of 0.080%), and Sierra Leonean ($48,286, a difference of 0.12%). Similarly, the demographic groups most similar to Koreans are Serbian ($48,677, a difference of 0.10%), Immigrants from Jordan ($48,673, a difference of 0.11%), Polish ($48,659, a difference of 0.14%), Chinese ($48,836, a difference of 0.22%), and Moroccan ($48,838, a difference of 0.23%).
| Demographics | Rating | Rank | Median Earnings |
| Immigrants | Kuwait | 96.8 /100 | #113 | Exceptional $48,861 |
| Moroccans | 96.7 /100 | #114 | Exceptional $48,838 |
| Chinese | 96.7 /100 | #115 | Exceptional $48,836 |
| Koreans | 96.2 /100 | #116 | Exceptional $48,727 |
| Serbians | 95.9 /100 | #117 | Exceptional $48,677 |
| Immigrants | Jordan | 95.9 /100 | #118 | Exceptional $48,673 |
| Poles | 95.8 /100 | #119 | Exceptional $48,659 |
| Carpatho Rusyns | 95.5 /100 | #120 | Exceptional $48,617 |
| Arabs | 95.4 /100 | #121 | Exceptional $48,599 |
| Chileans | 94.8 /100 | #122 | Exceptional $48,504 |
| Immigrants | Syria | 93.9 /100 | #123 | Exceptional $48,375 |
| Brazilians | 93.7 /100 | #124 | Exceptional $48,356 |
| Immigrants | Fiji | 93.3 /100 | #125 | Exceptional $48,305 |
| Assyrians/Chaldeans/Syriacs | 93.3 /100 | #126 | Exceptional $48,304 |
| Sierra Leoneans | 93.1 /100 | #127 | Exceptional $48,286 |
| Immigrants | Philippines | 92.9 /100 | #128 | Exceptional $48,266 |
| Pakistanis | 92.8 /100 | #129 | Exceptional $48,254 |
| Zimbabweans | 92.6 /100 | #130 | Exceptional $48,229 |
| Lebanese | 92.5 /100 | #131 | Exceptional $48,226 |
| British | 92.2 /100 | #132 | Exceptional $48,189 |
| Immigrants | Uganda | 90.5 /100 | #133 | Exceptional $48,041 |