Latvian vs Immigrants from Northern Europe Median Female Earnings
COMPARE
Latvian
Immigrants from Northern Europe
Median Female Earnings
Median Female Earnings Comparison
Latvians
Immigrants from Northern Europe
$43,941
MEDIAN FEMALE EARNINGS
100.0/ 100
METRIC RATING
38th/ 347
METRIC RANK
$44,366
MEDIAN FEMALE EARNINGS
100.0/ 100
METRIC RATING
32nd/ 347
METRIC RANK
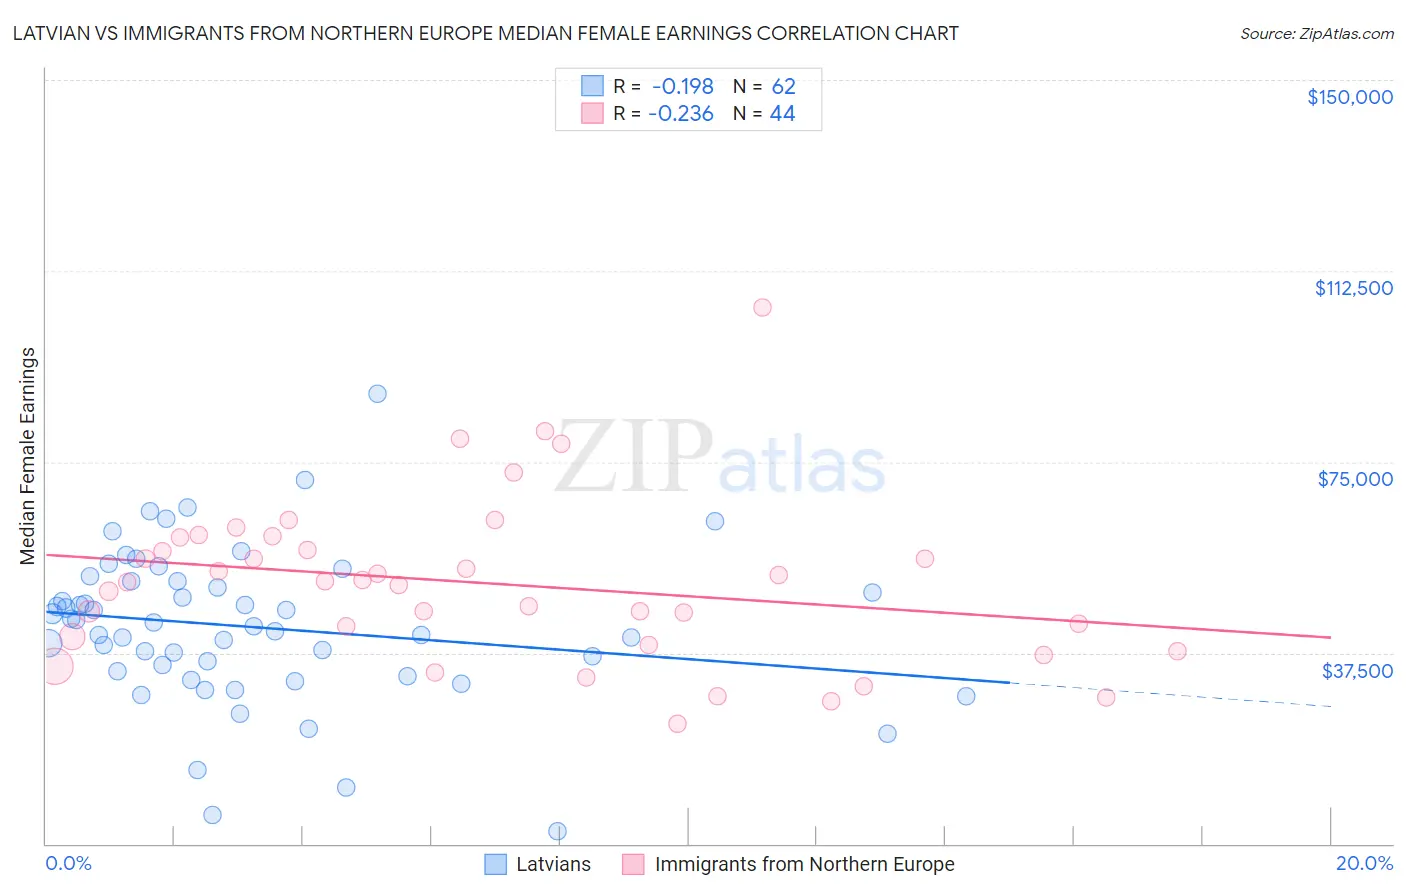
Latvian vs Immigrants from Northern Europe Median Female Earnings Correlation Chart
The statistical analysis conducted on geographies consisting of 220,706,355 people shows a poor negative correlation between the proportion of Latvians and median female earnings in the United States with a correlation coefficient (R) of -0.198 and weighted average of $43,941. Similarly, the statistical analysis conducted on geographies consisting of 476,746,043 people shows a weak negative correlation between the proportion of Immigrants from Northern Europe and median female earnings in the United States with a correlation coefficient (R) of -0.236 and weighted average of $44,366, a difference of 0.97%.
Median Female Earnings Correlation Summary
| Measurement | Latvian | Immigrants from Northern Europe |
| Minimum | $2,499 | $23,685 |
| Maximum | $88,365 | $105,254 |
| Range | $85,866 | $81,569 |
| Mean | $42,555 | $51,135 |
| Median | $43,118 | $51,432 |
| Interquartile 25% (IQ1) | $33,868 | $39,901 |
| Interquartile 75% (IQ3) | $51,451 | $58,905 |
| Interquartile Range (IQR) | $17,583 | $19,004 |
| Standard Deviation (Sample) | $15,211 | $16,162 |
| Standard Deviation (Population) | $15,087 | $15,978 |
Demographics Similar to Latvians and Immigrants from Northern Europe by Median Female Earnings
In terms of median female earnings, the demographic groups most similar to Latvians are Immigrants from Switzerland ($43,996, a difference of 0.12%), Israeli ($43,852, a difference of 0.20%), Immigrants from Malaysia ($43,835, a difference of 0.24%), Immigrants from Turkey ($44,066, a difference of 0.28%), and Immigrants from Sri Lanka ($44,161, a difference of 0.50%). Similarly, the demographic groups most similar to Immigrants from Northern Europe are Immigrants from Asia ($44,198, a difference of 0.38%), Immigrants from France ($44,541, a difference of 0.40%), Russian ($44,169, a difference of 0.44%), Immigrants from Sri Lanka ($44,161, a difference of 0.46%), and Immigrants from Belgium ($44,587, a difference of 0.50%).
| Demographics | Rating | Rank | Median Female Earnings |
| Immigrants | Sweden | 100.0 /100 | #25 | Exceptional $44,774 |
| Immigrants | Belarus | 100.0 /100 | #26 | Exceptional $44,757 |
| Turks | 100.0 /100 | #27 | Exceptional $44,695 |
| Immigrants | Russia | 100.0 /100 | #28 | Exceptional $44,680 |
| Immigrants | Belgium | 100.0 /100 | #29 | Exceptional $44,587 |
| Asians | 100.0 /100 | #30 | Exceptional $44,586 |
| Immigrants | France | 100.0 /100 | #31 | Exceptional $44,541 |
| Immigrants | Northern Europe | 100.0 /100 | #32 | Exceptional $44,366 |
| Immigrants | Asia | 100.0 /100 | #33 | Exceptional $44,198 |
| Russians | 100.0 /100 | #34 | Exceptional $44,169 |
| Immigrants | Sri Lanka | 100.0 /100 | #35 | Exceptional $44,161 |
| Immigrants | Turkey | 100.0 /100 | #36 | Exceptional $44,066 |
| Immigrants | Switzerland | 100.0 /100 | #37 | Exceptional $43,996 |
| Latvians | 100.0 /100 | #38 | Exceptional $43,941 |
| Israelis | 100.0 /100 | #39 | Exceptional $43,852 |
| Immigrants | Malaysia | 100.0 /100 | #40 | Exceptional $43,835 |
| Bhutanese | 100.0 /100 | #41 | Exceptional $43,648 |
| Immigrants | Denmark | 100.0 /100 | #42 | Exceptional $43,646 |
| Bulgarians | 100.0 /100 | #43 | Exceptional $43,638 |
| Immigrants | Czechoslovakia | 100.0 /100 | #44 | Exceptional $43,571 |
| Immigrants | Europe | 100.0 /100 | #45 | Exceptional $43,523 |