Latvian vs Immigrants from Saudi Arabia Median Female Earnings
COMPARE
Latvian
Immigrants from Saudi Arabia
Median Female Earnings
Median Female Earnings Comparison
Latvians
Immigrants from Saudi Arabia
$43,941
MEDIAN FEMALE EARNINGS
100.0/ 100
METRIC RATING
38th/ 347
METRIC RANK
$39,952
MEDIAN FEMALE EARNINGS
62.9/ 100
METRIC RATING
164th/ 347
METRIC RANK
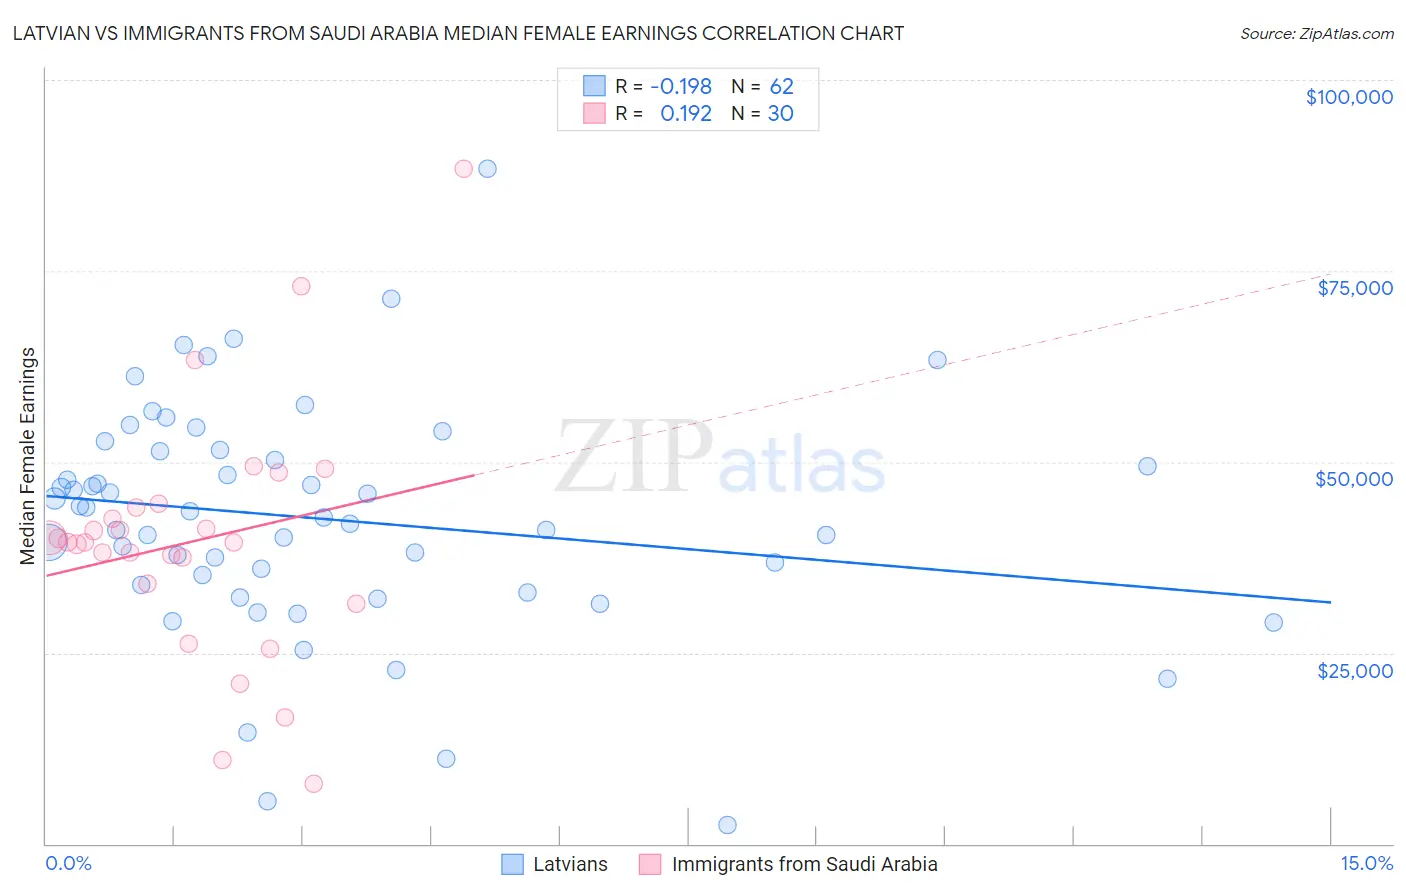
Latvian vs Immigrants from Saudi Arabia Median Female Earnings Correlation Chart
The statistical analysis conducted on geographies consisting of 220,706,355 people shows a poor negative correlation between the proportion of Latvians and median female earnings in the United States with a correlation coefficient (R) of -0.198 and weighted average of $43,941. Similarly, the statistical analysis conducted on geographies consisting of 164,288,705 people shows a poor positive correlation between the proportion of Immigrants from Saudi Arabia and median female earnings in the United States with a correlation coefficient (R) of 0.192 and weighted average of $39,952, a difference of 10.0%.
Median Female Earnings Correlation Summary
| Measurement | Latvian | Immigrants from Saudi Arabia |
| Minimum | $2,499 | $7,776 |
| Maximum | $88,365 | $88,365 |
| Range | $85,866 | $80,589 |
| Mean | $42,555 | $39,642 |
| Median | $43,118 | $39,517 |
| Interquartile 25% (IQ1) | $33,868 | $34,071 |
| Interquartile 75% (IQ3) | $51,451 | $44,081 |
| Interquartile Range (IQR) | $17,583 | $10,011 |
| Standard Deviation (Sample) | $15,211 | $16,173 |
| Standard Deviation (Population) | $15,087 | $15,901 |
Similar Demographics by Median Female Earnings
Demographics Similar to Latvians by Median Female Earnings
In terms of median female earnings, the demographic groups most similar to Latvians are Immigrants from Switzerland ($43,996, a difference of 0.12%), Israeli ($43,852, a difference of 0.20%), Immigrants from Malaysia ($43,835, a difference of 0.24%), Immigrants from Turkey ($44,066, a difference of 0.28%), and Immigrants from Sri Lanka ($44,161, a difference of 0.50%).
| Demographics | Rating | Rank | Median Female Earnings |
| Immigrants | France | 100.0 /100 | #31 | Exceptional $44,541 |
| Immigrants | Northern Europe | 100.0 /100 | #32 | Exceptional $44,366 |
| Immigrants | Asia | 100.0 /100 | #33 | Exceptional $44,198 |
| Russians | 100.0 /100 | #34 | Exceptional $44,169 |
| Immigrants | Sri Lanka | 100.0 /100 | #35 | Exceptional $44,161 |
| Immigrants | Turkey | 100.0 /100 | #36 | Exceptional $44,066 |
| Immigrants | Switzerland | 100.0 /100 | #37 | Exceptional $43,996 |
| Latvians | 100.0 /100 | #38 | Exceptional $43,941 |
| Israelis | 100.0 /100 | #39 | Exceptional $43,852 |
| Immigrants | Malaysia | 100.0 /100 | #40 | Exceptional $43,835 |
| Bhutanese | 100.0 /100 | #41 | Exceptional $43,648 |
| Immigrants | Denmark | 100.0 /100 | #42 | Exceptional $43,646 |
| Bulgarians | 100.0 /100 | #43 | Exceptional $43,638 |
| Immigrants | Czechoslovakia | 100.0 /100 | #44 | Exceptional $43,571 |
| Immigrants | Europe | 100.0 /100 | #45 | Exceptional $43,523 |
Demographics Similar to Immigrants from Saudi Arabia by Median Female Earnings
In terms of median female earnings, the demographic groups most similar to Immigrants from Saudi Arabia are Immigrants from Bangladesh ($39,910, a difference of 0.11%), Lebanese ($40,006, a difference of 0.14%), Immigrants from Ghana ($39,894, a difference of 0.15%), Luxembourger ($39,891, a difference of 0.15%), and South American Indian ($40,019, a difference of 0.17%).
| Demographics | Rating | Rank | Median Female Earnings |
| Portuguese | 73.0 /100 | #157 | Good $40,177 |
| Immigrants | Senegal | 72.2 /100 | #158 | Good $40,157 |
| Immigrants | Vietnam | 72.0 /100 | #159 | Good $40,153 |
| Inupiat | 68.9 /100 | #160 | Good $40,080 |
| Alsatians | 68.0 /100 | #161 | Good $40,060 |
| South American Indians | 66.1 /100 | #162 | Good $40,019 |
| Lebanese | 65.5 /100 | #163 | Good $40,006 |
| Immigrants | Saudi Arabia | 62.9 /100 | #164 | Good $39,952 |
| Immigrants | Bangladesh | 60.8 /100 | #165 | Good $39,910 |
| Immigrants | Ghana | 60.0 /100 | #166 | Good $39,894 |
| Luxembourgers | 59.9 /100 | #167 | Average $39,891 |
| Immigrants | Peru | 58.9 /100 | #168 | Average $39,871 |
| Kenyans | 58.4 /100 | #169 | Average $39,860 |
| Slovenes | 56.2 /100 | #170 | Average $39,817 |
| Immigrants | Portugal | 54.7 /100 | #171 | Average $39,788 |