Lebanese vs Immigrants from Northern Europe Median Female Earnings
COMPARE
Lebanese
Immigrants from Northern Europe
Median Female Earnings
Median Female Earnings Comparison
Lebanese
Immigrants from Northern Europe
$40,006
MEDIAN FEMALE EARNINGS
65.5/ 100
METRIC RATING
163rd/ 347
METRIC RANK
$44,366
MEDIAN FEMALE EARNINGS
100.0/ 100
METRIC RATING
32nd/ 347
METRIC RANK
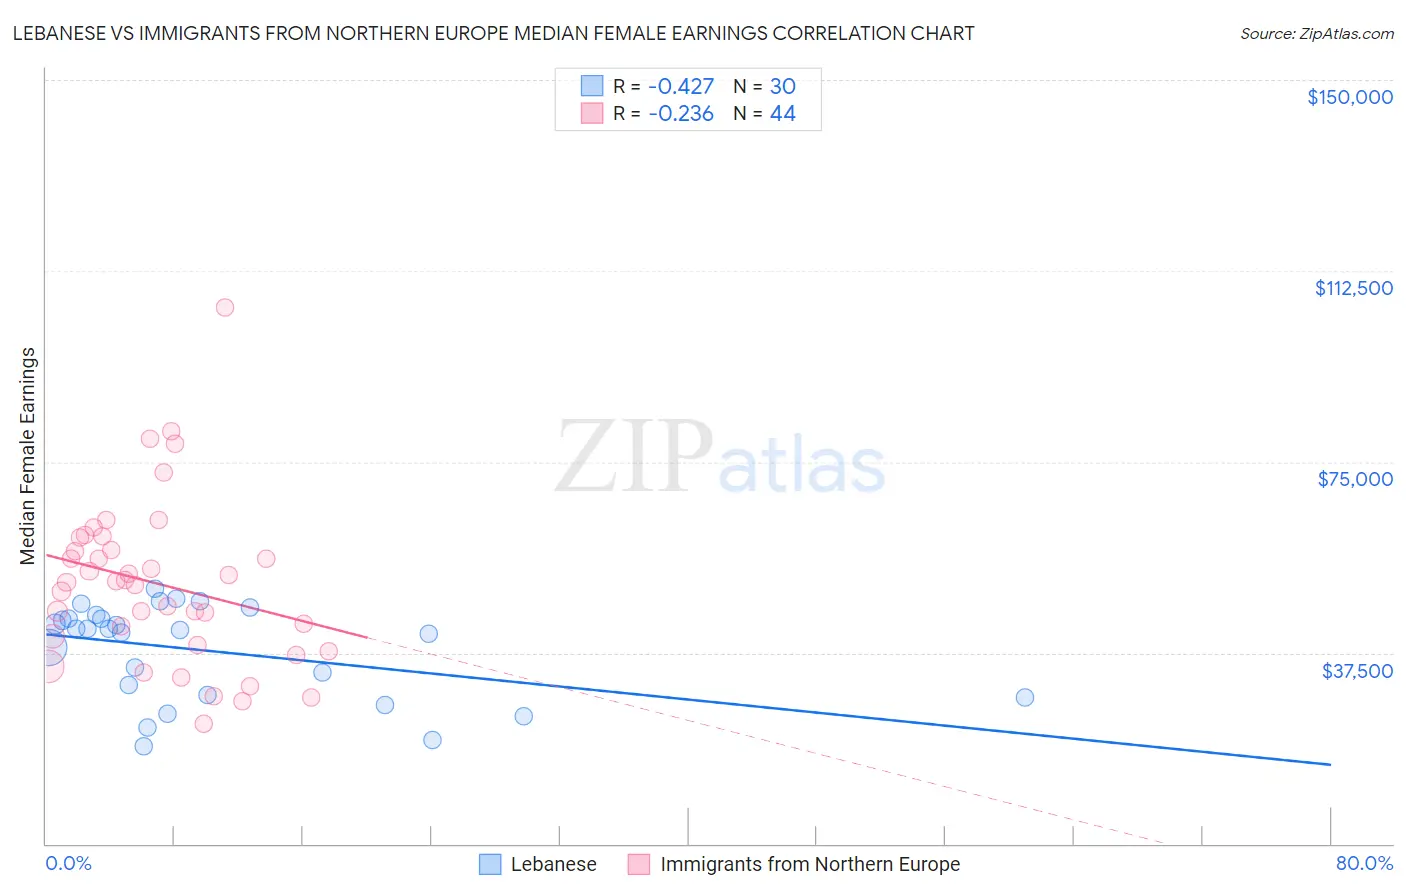
Lebanese vs Immigrants from Northern Europe Median Female Earnings Correlation Chart
The statistical analysis conducted on geographies consisting of 401,457,722 people shows a moderate negative correlation between the proportion of Lebanese and median female earnings in the United States with a correlation coefficient (R) of -0.427 and weighted average of $40,006. Similarly, the statistical analysis conducted on geographies consisting of 476,746,043 people shows a weak negative correlation between the proportion of Immigrants from Northern Europe and median female earnings in the United States with a correlation coefficient (R) of -0.236 and weighted average of $44,366, a difference of 10.9%.
Median Female Earnings Correlation Summary
| Measurement | Lebanese | Immigrants from Northern Europe |
| Minimum | $19,128 | $23,685 |
| Maximum | $50,050 | $105,254 |
| Range | $30,922 | $81,569 |
| Mean | $37,921 | $51,135 |
| Median | $42,088 | $51,432 |
| Interquartile 25% (IQ1) | $29,289 | $39,901 |
| Interquartile 75% (IQ3) | $44,167 | $58,905 |
| Interquartile Range (IQR) | $14,878 | $19,004 |
| Standard Deviation (Sample) | $9,199 | $16,162 |
| Standard Deviation (Population) | $9,044 | $15,978 |
Similar Demographics by Median Female Earnings
Demographics Similar to Lebanese by Median Female Earnings
In terms of median female earnings, the demographic groups most similar to Lebanese are South American Indian ($40,019, a difference of 0.030%), Alsatian ($40,060, a difference of 0.14%), Immigrants from Saudi Arabia ($39,952, a difference of 0.14%), Inupiat ($40,080, a difference of 0.18%), and Immigrants from Bangladesh ($39,910, a difference of 0.24%).
| Demographics | Rating | Rank | Median Female Earnings |
| Peruvians | 75.3 /100 | #156 | Good $40,234 |
| Portuguese | 73.0 /100 | #157 | Good $40,177 |
| Immigrants | Senegal | 72.2 /100 | #158 | Good $40,157 |
| Immigrants | Vietnam | 72.0 /100 | #159 | Good $40,153 |
| Inupiat | 68.9 /100 | #160 | Good $40,080 |
| Alsatians | 68.0 /100 | #161 | Good $40,060 |
| South American Indians | 66.1 /100 | #162 | Good $40,019 |
| Lebanese | 65.5 /100 | #163 | Good $40,006 |
| Immigrants | Saudi Arabia | 62.9 /100 | #164 | Good $39,952 |
| Immigrants | Bangladesh | 60.8 /100 | #165 | Good $39,910 |
| Immigrants | Ghana | 60.0 /100 | #166 | Good $39,894 |
| Luxembourgers | 59.9 /100 | #167 | Average $39,891 |
| Immigrants | Peru | 58.9 /100 | #168 | Average $39,871 |
| Kenyans | 58.4 /100 | #169 | Average $39,860 |
| Slovenes | 56.2 /100 | #170 | Average $39,817 |
Demographics Similar to Immigrants from Northern Europe by Median Female Earnings
In terms of median female earnings, the demographic groups most similar to Immigrants from Northern Europe are Immigrants from Asia ($44,198, a difference of 0.38%), Immigrants from France ($44,541, a difference of 0.40%), Russian ($44,169, a difference of 0.44%), Immigrants from Sri Lanka ($44,161, a difference of 0.46%), and Immigrants from Belgium ($44,587, a difference of 0.50%).
| Demographics | Rating | Rank | Median Female Earnings |
| Immigrants | Sweden | 100.0 /100 | #25 | Exceptional $44,774 |
| Immigrants | Belarus | 100.0 /100 | #26 | Exceptional $44,757 |
| Turks | 100.0 /100 | #27 | Exceptional $44,695 |
| Immigrants | Russia | 100.0 /100 | #28 | Exceptional $44,680 |
| Immigrants | Belgium | 100.0 /100 | #29 | Exceptional $44,587 |
| Asians | 100.0 /100 | #30 | Exceptional $44,586 |
| Immigrants | France | 100.0 /100 | #31 | Exceptional $44,541 |
| Immigrants | Northern Europe | 100.0 /100 | #32 | Exceptional $44,366 |
| Immigrants | Asia | 100.0 /100 | #33 | Exceptional $44,198 |
| Russians | 100.0 /100 | #34 | Exceptional $44,169 |
| Immigrants | Sri Lanka | 100.0 /100 | #35 | Exceptional $44,161 |
| Immigrants | Turkey | 100.0 /100 | #36 | Exceptional $44,066 |
| Immigrants | Switzerland | 100.0 /100 | #37 | Exceptional $43,996 |
| Latvians | 100.0 /100 | #38 | Exceptional $43,941 |
| Israelis | 100.0 /100 | #39 | Exceptional $43,852 |