Delaware vs Immigrants from Northern Europe Median Female Earnings
COMPARE
Delaware
Immigrants from Northern Europe
Median Female Earnings
Median Female Earnings Comparison
Delaware
Immigrants from Northern Europe
$37,964
MEDIAN FEMALE EARNINGS
2.6/ 100
METRIC RATING
246th/ 347
METRIC RANK
$44,366
MEDIAN FEMALE EARNINGS
100.0/ 100
METRIC RATING
32nd/ 347
METRIC RANK
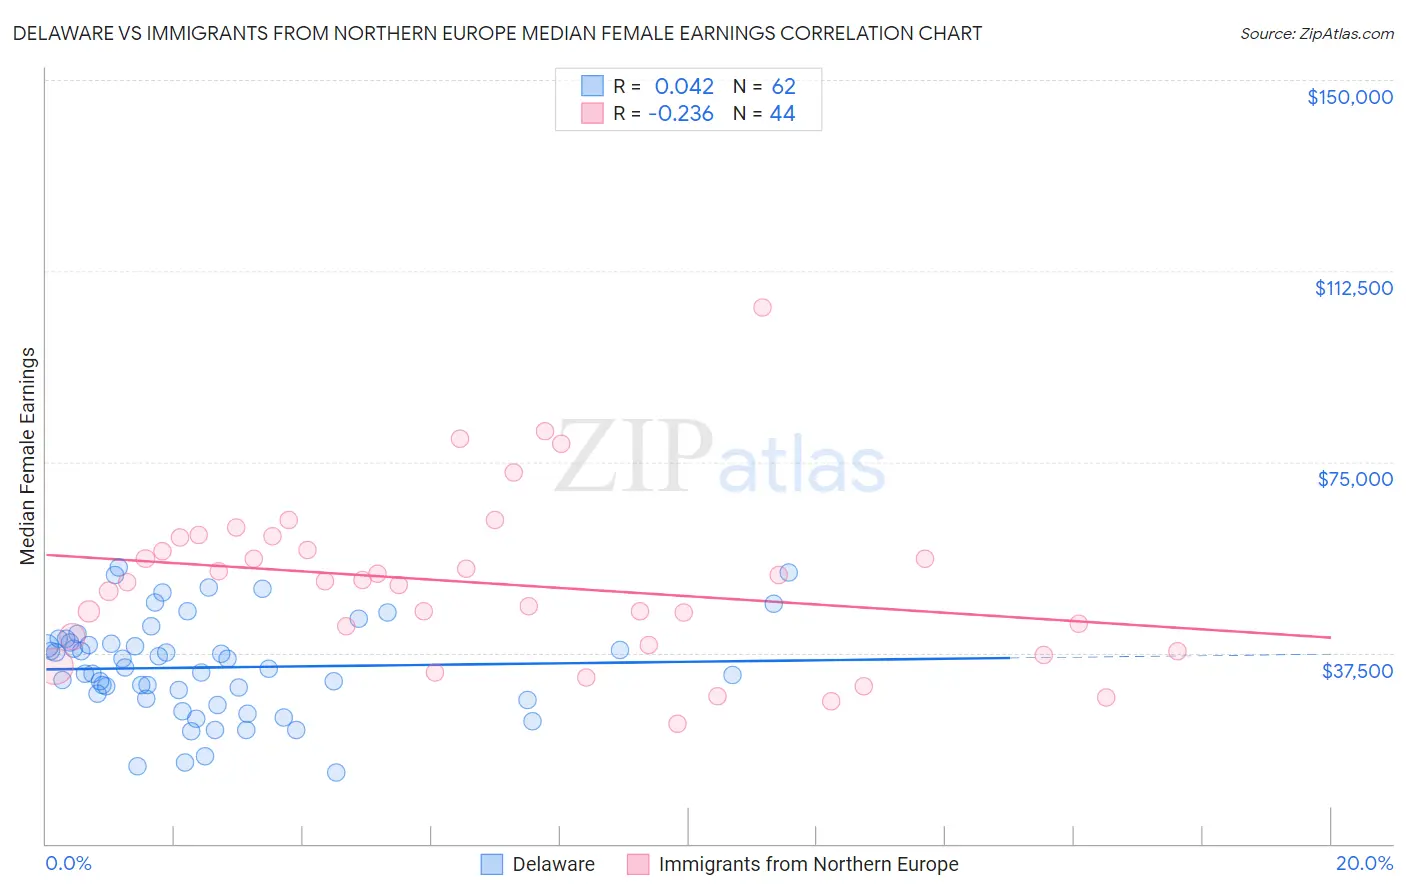
Delaware vs Immigrants from Northern Europe Median Female Earnings Correlation Chart
The statistical analysis conducted on geographies consisting of 96,216,282 people shows no correlation between the proportion of Delaware and median female earnings in the United States with a correlation coefficient (R) of 0.042 and weighted average of $37,964. Similarly, the statistical analysis conducted on geographies consisting of 476,746,043 people shows a weak negative correlation between the proportion of Immigrants from Northern Europe and median female earnings in the United States with a correlation coefficient (R) of -0.236 and weighted average of $44,366, a difference of 16.9%.
Median Female Earnings Correlation Summary
| Measurement | Delaware | Immigrants from Northern Europe |
| Minimum | $13,945 | $23,685 |
| Maximum | $54,207 | $105,254 |
| Range | $40,262 | $81,569 |
| Mean | $34,638 | $51,135 |
| Median | $34,456 | $51,432 |
| Interquartile 25% (IQ1) | $28,462 | $39,901 |
| Interquartile 75% (IQ3) | $39,551 | $58,905 |
| Interquartile Range (IQR) | $11,089 | $19,004 |
| Standard Deviation (Sample) | $9,560 | $16,162 |
| Standard Deviation (Population) | $9,482 | $15,978 |
Similar Demographics by Median Female Earnings
Demographics Similar to Delaware by Median Female Earnings
In terms of median female earnings, the demographic groups most similar to Delaware are Immigrants from Middle Africa ($37,965, a difference of 0.0%), Immigrants from Liberia ($37,970, a difference of 0.010%), German ($37,986, a difference of 0.060%), Immigrants from Somalia ($37,914, a difference of 0.13%), and Alaskan Athabascan ($37,905, a difference of 0.16%).
| Demographics | Rating | Rank | Median Female Earnings |
| English | 4.2 /100 | #239 | Tragic $38,196 |
| Finns | 4.0 /100 | #240 | Tragic $38,173 |
| Spanish | 3.5 /100 | #241 | Tragic $38,098 |
| Immigrants | Burma/Myanmar | 3.0 /100 | #242 | Tragic $38,028 |
| Germans | 2.8 /100 | #243 | Tragic $37,986 |
| Immigrants | Liberia | 2.7 /100 | #244 | Tragic $37,970 |
| Immigrants | Middle Africa | 2.7 /100 | #245 | Tragic $37,965 |
| Delaware | 2.6 /100 | #246 | Tragic $37,964 |
| Immigrants | Somalia | 2.4 /100 | #247 | Tragic $37,914 |
| Alaskan Athabascans | 2.3 /100 | #248 | Tragic $37,905 |
| Swiss | 2.3 /100 | #249 | Tragic $37,904 |
| Immigrants | Iraq | 2.2 /100 | #250 | Tragic $37,864 |
| Welsh | 2.1 /100 | #251 | Tragic $37,856 |
| Immigrants | Dominica | 2.0 /100 | #252 | Tragic $37,825 |
| Danes | 1.6 /100 | #253 | Tragic $37,730 |
Demographics Similar to Immigrants from Northern Europe by Median Female Earnings
In terms of median female earnings, the demographic groups most similar to Immigrants from Northern Europe are Immigrants from Asia ($44,198, a difference of 0.38%), Immigrants from France ($44,541, a difference of 0.40%), Russian ($44,169, a difference of 0.44%), Immigrants from Sri Lanka ($44,161, a difference of 0.46%), and Immigrants from Belgium ($44,587, a difference of 0.50%).
| Demographics | Rating | Rank | Median Female Earnings |
| Immigrants | Sweden | 100.0 /100 | #25 | Exceptional $44,774 |
| Immigrants | Belarus | 100.0 /100 | #26 | Exceptional $44,757 |
| Turks | 100.0 /100 | #27 | Exceptional $44,695 |
| Immigrants | Russia | 100.0 /100 | #28 | Exceptional $44,680 |
| Immigrants | Belgium | 100.0 /100 | #29 | Exceptional $44,587 |
| Asians | 100.0 /100 | #30 | Exceptional $44,586 |
| Immigrants | France | 100.0 /100 | #31 | Exceptional $44,541 |
| Immigrants | Northern Europe | 100.0 /100 | #32 | Exceptional $44,366 |
| Immigrants | Asia | 100.0 /100 | #33 | Exceptional $44,198 |
| Russians | 100.0 /100 | #34 | Exceptional $44,169 |
| Immigrants | Sri Lanka | 100.0 /100 | #35 | Exceptional $44,161 |
| Immigrants | Turkey | 100.0 /100 | #36 | Exceptional $44,066 |
| Immigrants | Switzerland | 100.0 /100 | #37 | Exceptional $43,996 |
| Latvians | 100.0 /100 | #38 | Exceptional $43,941 |
| Israelis | 100.0 /100 | #39 | Exceptional $43,852 |