Laotian vs Carpatho Rusyn Householder Income Ages 25 - 44 years
COMPARE
Laotian
Carpatho Rusyn
Householder Income Ages 25 - 44 years
Householder Income Ages 25 - 44 years Comparison
Laotians
Carpatho Rusyns
$104,993
HOUSEHOLDER INCOME AGES 25 - 44 YEARS
99.7/ 100
METRIC RATING
66th/ 347
METRIC RANK
$99,449
HOUSEHOLDER INCOME AGES 25 - 44 YEARS
93.7/ 100
METRIC RATING
115th/ 347
METRIC RANK
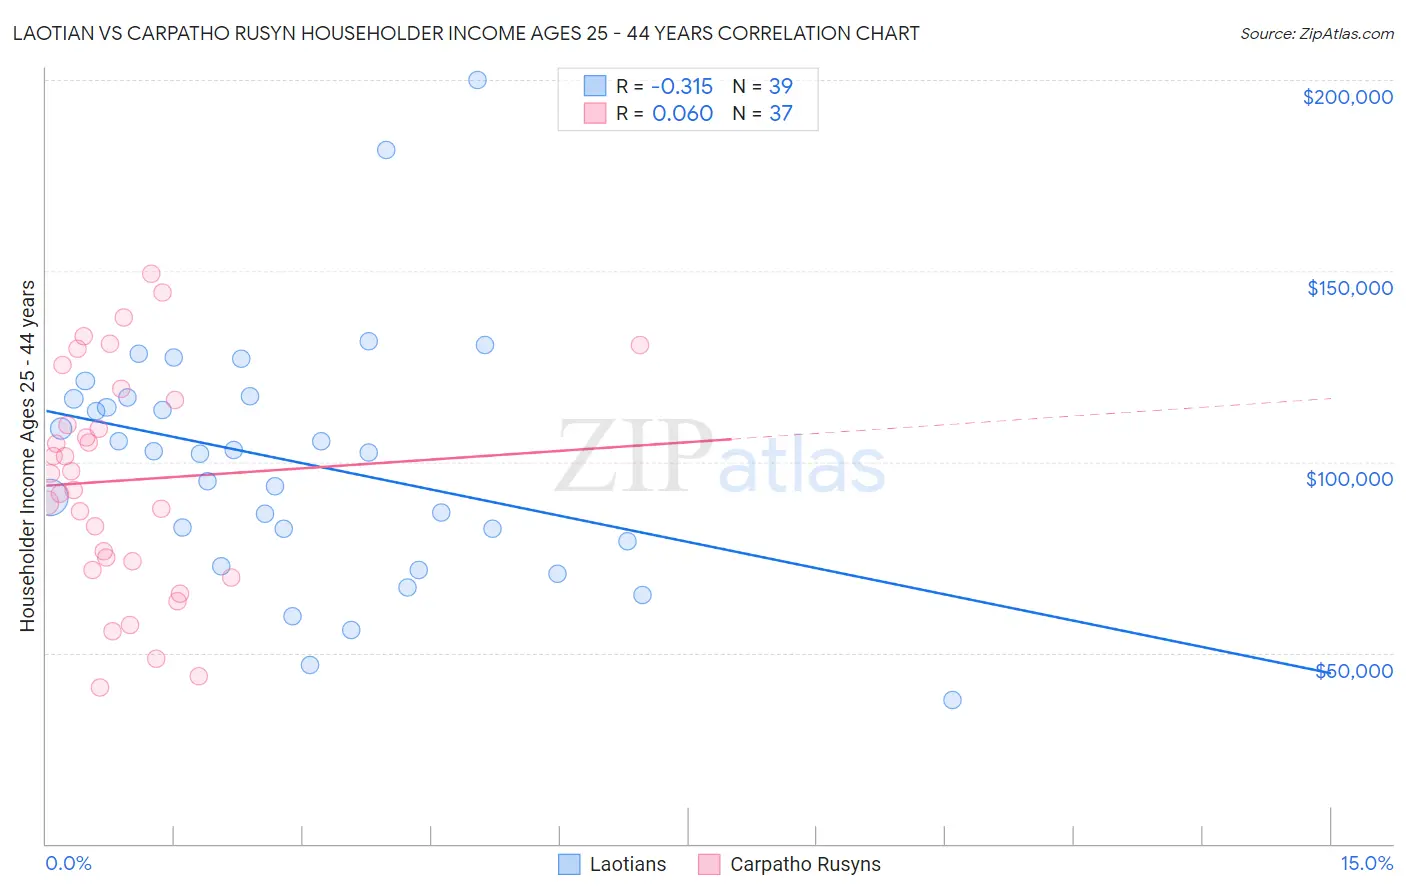
Laotian vs Carpatho Rusyn Householder Income Ages 25 - 44 years Correlation Chart
The statistical analysis conducted on geographies consisting of 224,507,973 people shows a mild negative correlation between the proportion of Laotians and household income with householder between the ages 25 and 44 in the United States with a correlation coefficient (R) of -0.315 and weighted average of $104,993. Similarly, the statistical analysis conducted on geographies consisting of 58,833,038 people shows a slight positive correlation between the proportion of Carpatho Rusyns and household income with householder between the ages 25 and 44 in the United States with a correlation coefficient (R) of 0.060 and weighted average of $99,449, a difference of 5.6%.
Householder Income Ages 25 - 44 years Correlation Summary
| Measurement | Laotian | Carpatho Rusyn |
| Minimum | $37,722 | $40,789 |
| Maximum | $199,931 | $149,241 |
| Range | $162,209 | $108,452 |
| Mean | $99,903 | $95,167 |
| Median | $102,522 | $96,892 |
| Interquartile 25% (IQ1) | $79,125 | $72,857 |
| Interquartile 75% (IQ3) | $116,790 | $117,797 |
| Interquartile Range (IQR) | $37,665 | $44,941 |
| Standard Deviation (Sample) | $32,336 | $29,061 |
| Standard Deviation (Population) | $31,919 | $28,665 |
Similar Demographics by Householder Income Ages 25 - 44 years
Demographics Similar to Laotians by Householder Income Ages 25 - 44 years
In terms of householder income ages 25 - 44 years, the demographic groups most similar to Laotians are Immigrants from Netherlands ($105,082, a difference of 0.080%), Immigrants from Scotland ($105,089, a difference of 0.090%), New Zealander ($105,085, a difference of 0.090%), Immigrants from Italy ($105,201, a difference of 0.20%), and Lithuanian ($105,223, a difference of 0.22%).
| Demographics | Rating | Rank | Householder Income Ages 25 - 44 years |
| Immigrants | Latvia | 99.8 /100 | #59 | Exceptional $105,522 |
| Egyptians | 99.7 /100 | #60 | Exceptional $105,282 |
| Lithuanians | 99.7 /100 | #61 | Exceptional $105,223 |
| Immigrants | Italy | 99.7 /100 | #62 | Exceptional $105,201 |
| Immigrants | Scotland | 99.7 /100 | #63 | Exceptional $105,089 |
| New Zealanders | 99.7 /100 | #64 | Exceptional $105,085 |
| Immigrants | Netherlands | 99.7 /100 | #65 | Exceptional $105,082 |
| Laotians | 99.7 /100 | #66 | Exceptional $104,993 |
| Immigrants | Romania | 99.6 /100 | #67 | Exceptional $104,713 |
| Immigrants | Eastern Europe | 99.6 /100 | #68 | Exceptional $104,662 |
| Mongolians | 99.6 /100 | #69 | Exceptional $104,578 |
| Immigrants | Croatia | 99.6 /100 | #70 | Exceptional $104,503 |
| Afghans | 99.6 /100 | #71 | Exceptional $104,410 |
| Chinese | 99.5 /100 | #72 | Exceptional $104,264 |
| Italians | 99.5 /100 | #73 | Exceptional $104,215 |
Demographics Similar to Carpatho Rusyns by Householder Income Ages 25 - 44 years
In terms of householder income ages 25 - 44 years, the demographic groups most similar to Carpatho Rusyns are Portuguese ($99,429, a difference of 0.020%), Immigrants from Western Asia ($99,516, a difference of 0.070%), Tongan ($99,604, a difference of 0.16%), Immigrants from Northern Africa ($99,232, a difference of 0.22%), and Polish ($99,685, a difference of 0.24%).
| Demographics | Rating | Rank | Householder Income Ages 25 - 44 years |
| Immigrants | South Eastern Asia | 96.0 /100 | #108 | Exceptional $100,283 |
| Immigrants | North Macedonia | 95.6 /100 | #109 | Exceptional $100,101 |
| Immigrants | Afghanistan | 95.3 /100 | #110 | Exceptional $99,977 |
| Chileans | 95.1 /100 | #111 | Exceptional $99,900 |
| Poles | 94.5 /100 | #112 | Exceptional $99,685 |
| Tongans | 94.2 /100 | #113 | Exceptional $99,604 |
| Immigrants | Western Asia | 94.0 /100 | #114 | Exceptional $99,516 |
| Carpatho Rusyns | 93.7 /100 | #115 | Exceptional $99,449 |
| Portuguese | 93.7 /100 | #116 | Exceptional $99,429 |
| Immigrants | Northern Africa | 93.0 /100 | #117 | Exceptional $99,232 |
| Syrians | 92.9 /100 | #118 | Exceptional $99,215 |
| Jordanians | 92.8 /100 | #119 | Exceptional $99,186 |
| Swedes | 92.7 /100 | #120 | Exceptional $99,136 |
| Peruvians | 91.7 /100 | #121 | Exceptional $98,886 |
| Immigrants | Uzbekistan | 91.5 /100 | #122 | Exceptional $98,849 |