Korean vs Nonimmigrants Unemployment Among Ages 35 to 44 years
COMPARE
Korean
Nonimmigrants
Unemployment Among Ages 35 to 44 years
Unemployment Among Ages 35 to 44 years Comparison
Koreans
Nonimmigrants
4.8%
UNEMPLOYMENT AMONG AGES 35 TO 44 YEARS
28.1/ 100
METRIC RATING
194th/ 347
METRIC RANK
4.9%
UNEMPLOYMENT AMONG AGES 35 TO 44 YEARS
9.4/ 100
METRIC RATING
211th/ 347
METRIC RANK
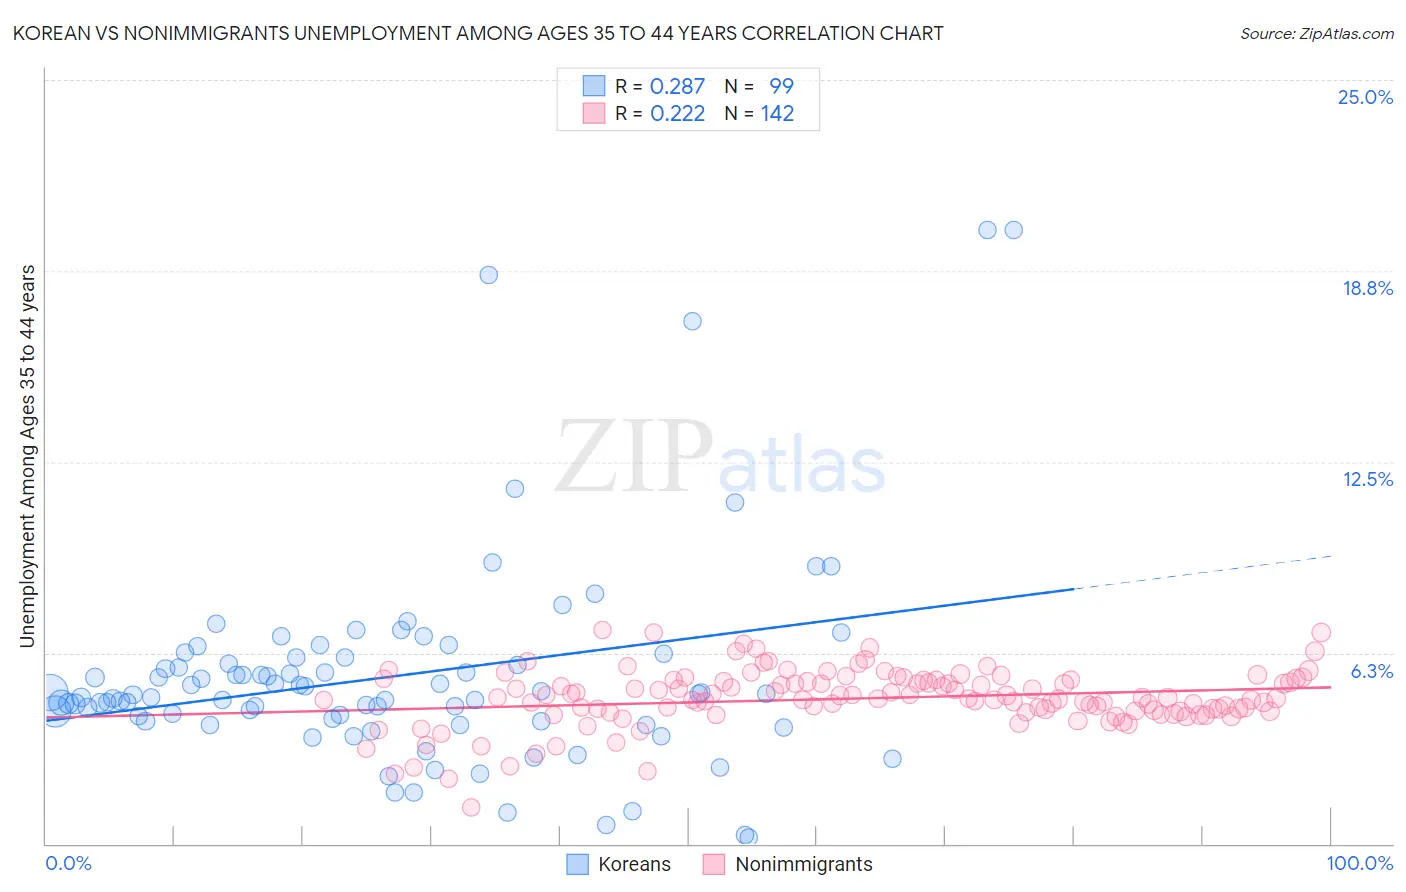
Korean vs Nonimmigrants Unemployment Among Ages 35 to 44 years Correlation Chart
The statistical analysis conducted on geographies consisting of 490,991,117 people shows a weak positive correlation between the proportion of Koreans and unemployment rate among population between the ages 35 and 44 in the United States with a correlation coefficient (R) of 0.287 and weighted average of 4.8%. Similarly, the statistical analysis conducted on geographies consisting of 530,556,110 people shows a weak positive correlation between the proportion of Nonimmigrants and unemployment rate among population between the ages 35 and 44 in the United States with a correlation coefficient (R) of 0.222 and weighted average of 4.9%, a difference of 2.3%.
Unemployment Among Ages 35 to 44 years Correlation Summary
| Measurement | Korean | Nonimmigrants |
| Minimum | 0.20% | 1.2% |
| Maximum | 20.1% | 7.0% |
| Range | 19.9% | 5.8% |
| Mean | 5.5% | 4.8% |
| Median | 4.9% | 4.8% |
| Interquartile 25% (IQ1) | 4.0% | 4.4% |
| Interquartile 75% (IQ3) | 6.1% | 5.3% |
| Interquartile Range (IQR) | 2.1% | 0.99% |
| Standard Deviation (Sample) | 3.4% | 0.94% |
| Standard Deviation (Population) | 3.4% | 0.94% |
Demographics Similar to Koreans and Nonimmigrants by Unemployment Among Ages 35 to 44 years
In terms of unemployment among ages 35 to 44 years, the demographic groups most similar to Koreans are Bangladeshi (4.8%, a difference of 0.010%), Immigrants from Albania (4.8%, a difference of 0.20%), Spanish (4.8%, a difference of 0.20%), Immigrants from Syria (4.8%, a difference of 0.40%), and Immigrants from Oceania (4.8%, a difference of 0.45%). Similarly, the demographic groups most similar to Nonimmigrants are Fijian (4.9%, a difference of 0.16%), Immigrants from Cameroon (4.9%, a difference of 0.36%), Immigrants from Uruguay (4.9%, a difference of 0.38%), French Canadian (4.8%, a difference of 1.1%), and Immigrants from Western Asia (4.8%, a difference of 1.1%).
| Demographics | Rating | Rank | Unemployment Among Ages 35 to 44 years |
| Immigrants | Albania | 30.5 /100 | #192 | Fair 4.8% |
| Spanish | 30.4 /100 | #193 | Fair 4.8% |
| Koreans | 28.1 /100 | #194 | Fair 4.8% |
| Bangladeshis | 28.0 /100 | #195 | Fair 4.8% |
| Immigrants | Syria | 23.6 /100 | #196 | Fair 4.8% |
| Immigrants | Oceania | 23.2 /100 | #197 | Fair 4.8% |
| Immigrants | Thailand | 22.9 /100 | #198 | Fair 4.8% |
| Immigrants | Middle Africa | 21.9 /100 | #199 | Fair 4.8% |
| Immigrants | Ukraine | 21.4 /100 | #200 | Fair 4.8% |
| Ugandans | 21.4 /100 | #201 | Fair 4.8% |
| Immigrants | Afghanistan | 20.2 /100 | #202 | Fair 4.8% |
| Uruguayans | 20.0 /100 | #203 | Fair 4.8% |
| Immigrants | Philippines | 19.8 /100 | #204 | Poor 4.8% |
| Spaniards | 18.7 /100 | #205 | Poor 4.8% |
| Soviet Union | 18.4 /100 | #206 | Poor 4.8% |
| Immigrants | Western Asia | 16.6 /100 | #207 | Poor 4.8% |
| French Canadians | 16.5 /100 | #208 | Poor 4.8% |
| Immigrants | Uruguay | 11.5 /100 | #209 | Poor 4.9% |
| Immigrants | Cameroon | 11.4 /100 | #210 | Poor 4.9% |
| Immigrants | Nonimmigrants | 9.4 /100 | #211 | Tragic 4.9% |
| Fijians | 8.7 /100 | #212 | Tragic 4.9% |