Korean vs Immigrants from Barbados No Schooling Completed
COMPARE
Korean
Immigrants from Barbados
No Schooling Completed
No Schooling Completed Comparison
Koreans
Immigrants from Barbados
2.4%
NO SCHOOLING COMPLETED
1.7/ 100
METRIC RATING
241st/ 347
METRIC RANK
2.7%
NO SCHOOLING COMPLETED
0.0/ 100
METRIC RATING
285th/ 347
METRIC RANK
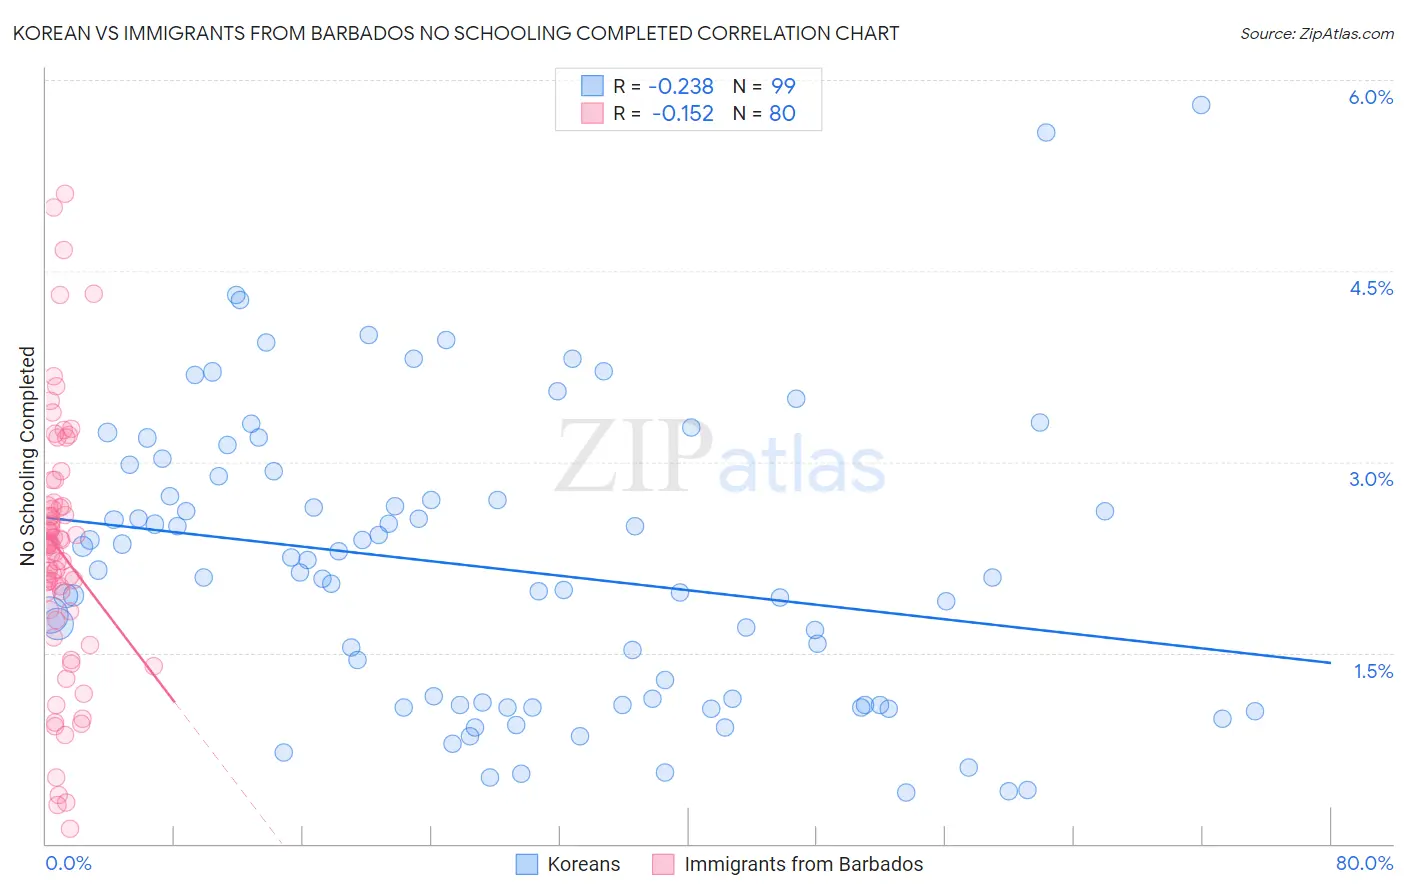
Korean vs Immigrants from Barbados No Schooling Completed Correlation Chart
The statistical analysis conducted on geographies consisting of 502,061,970 people shows a weak negative correlation between the proportion of Koreans and percentage of population with no schooling in the United States with a correlation coefficient (R) of -0.238 and weighted average of 2.4%. Similarly, the statistical analysis conducted on geographies consisting of 112,603,347 people shows a poor negative correlation between the proportion of Immigrants from Barbados and percentage of population with no schooling in the United States with a correlation coefficient (R) of -0.152 and weighted average of 2.7%, a difference of 11.8%.
No Schooling Completed Correlation Summary
| Measurement | Korean | Immigrants from Barbados |
| Minimum | 0.40% | 0.12% |
| Maximum | 5.8% | 5.1% |
| Range | 5.4% | 5.0% |
| Mean | 2.2% | 2.3% |
| Median | 2.1% | 2.4% |
| Interquartile 25% (IQ1) | 1.1% | 1.8% |
| Interquartile 75% (IQ3) | 2.9% | 2.6% |
| Interquartile Range (IQR) | 1.8% | 0.82% |
| Standard Deviation (Sample) | 1.1% | 1.0% |
| Standard Deviation (Population) | 1.1% | 1.00% |
Similar Demographics by No Schooling Completed
Demographics Similar to Koreans by No Schooling Completed
In terms of no schooling completed, the demographic groups most similar to Koreans are Immigrants from Senegal (2.4%, a difference of 0.060%), Liberian (2.4%, a difference of 0.29%), Immigrants from Indonesia (2.4%, a difference of 0.32%), South American (2.4%, a difference of 0.36%), and Paiute (2.4%, a difference of 0.41%).
| Demographics | Rating | Rank | No Schooling Completed |
| Nigerians | 2.6 /100 | #234 | Tragic 2.3% |
| Immigrants | Western Asia | 2.6 /100 | #235 | Tragic 2.3% |
| Iraqis | 2.2 /100 | #236 | Tragic 2.4% |
| Immigrants | Eastern Asia | 2.0 /100 | #237 | Tragic 2.4% |
| Paiute | 1.9 /100 | #238 | Tragic 2.4% |
| Liberians | 1.8 /100 | #239 | Tragic 2.4% |
| Immigrants | Senegal | 1.7 /100 | #240 | Tragic 2.4% |
| Koreans | 1.7 /100 | #241 | Tragic 2.4% |
| Immigrants | Indonesia | 1.5 /100 | #242 | Tragic 2.4% |
| South Americans | 1.5 /100 | #243 | Tragic 2.4% |
| Peruvians | 1.4 /100 | #244 | Tragic 2.4% |
| Bolivians | 1.4 /100 | #245 | Tragic 2.4% |
| Immigrants | Congo | 1.4 /100 | #246 | Tragic 2.4% |
| Immigrants | Iraq | 1.3 /100 | #247 | Tragic 2.4% |
| Asians | 1.2 /100 | #248 | Tragic 2.4% |
Demographics Similar to Immigrants from Barbados by No Schooling Completed
In terms of no schooling completed, the demographic groups most similar to Immigrants from Barbados are Immigrants from West Indies (2.7%, a difference of 0.070%), Immigrants from Portugal (2.7%, a difference of 0.42%), Immigrants from Trinidad and Tobago (2.6%, a difference of 0.80%), Immigrants from Afghanistan (2.7%, a difference of 1.2%), and Immigrants from St. Vincent and the Grenadines (2.7%, a difference of 1.3%).
| Demographics | Rating | Rank | No Schooling Completed |
| Immigrants | Uzbekistan | 0.1 /100 | #278 | Tragic 2.6% |
| Barbadians | 0.1 /100 | #279 | Tragic 2.6% |
| Trinidadians and Tobagonians | 0.1 /100 | #280 | Tragic 2.6% |
| Afghans | 0.1 /100 | #281 | Tragic 2.6% |
| Immigrants | Ghana | 0.1 /100 | #282 | Tragic 2.6% |
| Immigrants | Trinidad and Tobago | 0.0 /100 | #283 | Tragic 2.6% |
| Immigrants | West Indies | 0.0 /100 | #284 | Tragic 2.7% |
| Immigrants | Barbados | 0.0 /100 | #285 | Tragic 2.7% |
| Immigrants | Portugal | 0.0 /100 | #286 | Tragic 2.7% |
| Immigrants | Afghanistan | 0.0 /100 | #287 | Tragic 2.7% |
| Immigrants | St. Vincent and the Grenadines | 0.0 /100 | #288 | Tragic 2.7% |
| Immigrants | Thailand | 0.0 /100 | #289 | Tragic 2.7% |
| Immigrants | Hong Kong | 0.0 /100 | #290 | Tragic 2.7% |
| British West Indians | 0.0 /100 | #291 | Tragic 2.7% |
| Immigrants | Grenada | 0.0 /100 | #292 | Tragic 2.8% |