Immigrants from Guyana vs Argentinean Median Male Earnings
COMPARE
Immigrants from Guyana
Argentinean
Median Male Earnings
Median Male Earnings Comparison
Immigrants from Guyana
Argentineans
$50,321
MEDIAN MALE EARNINGS
1.6/ 100
METRIC RATING
248th/ 347
METRIC RANK
$60,117
MEDIAN MALE EARNINGS
99.6/ 100
METRIC RATING
74th/ 347
METRIC RANK
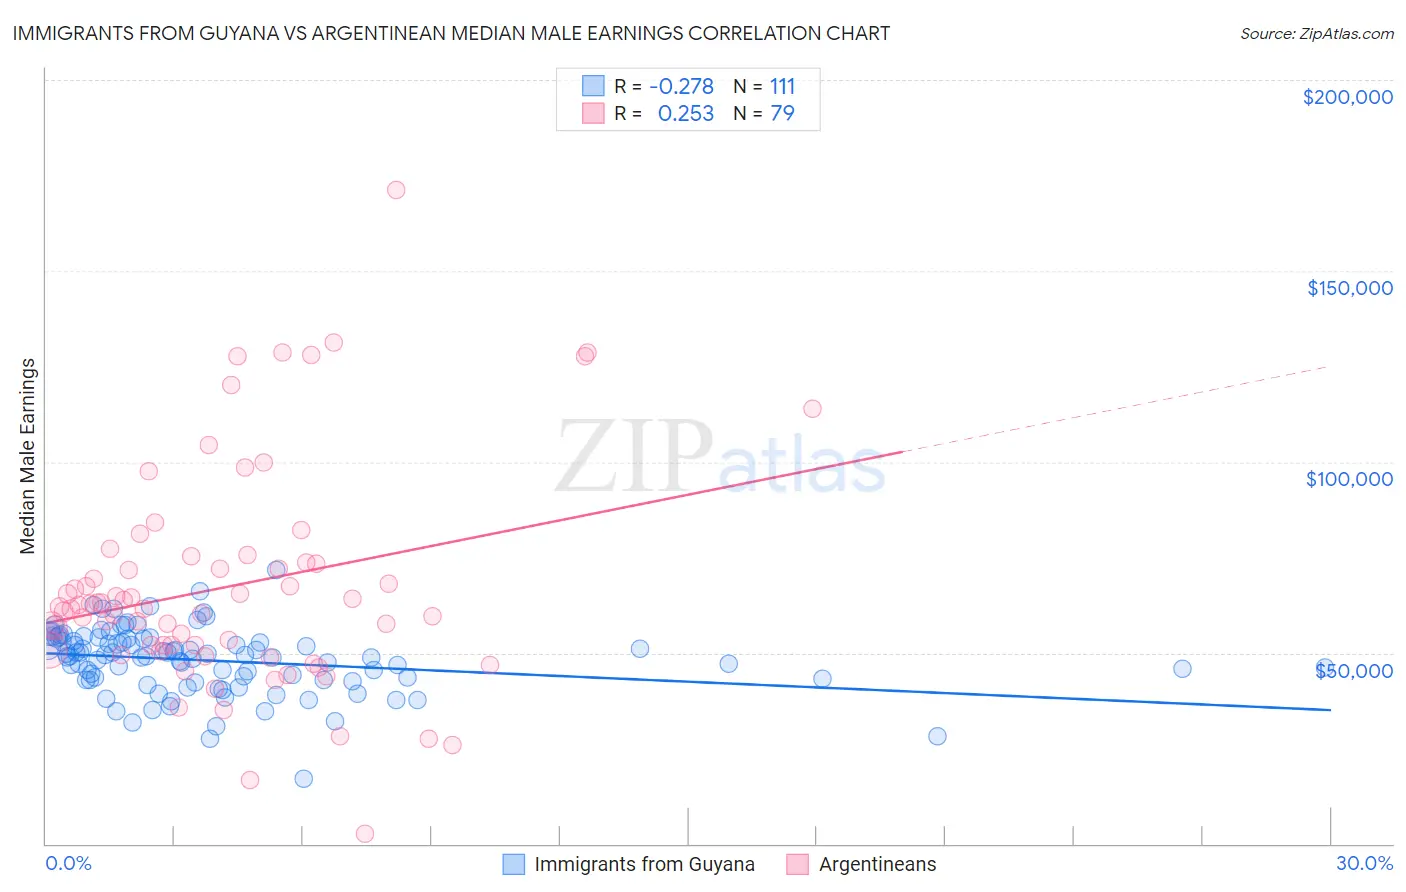
Immigrants from Guyana vs Argentinean Median Male Earnings Correlation Chart
The statistical analysis conducted on geographies consisting of 183,717,574 people shows a weak negative correlation between the proportion of Immigrants from Guyana and median male earnings in the United States with a correlation coefficient (R) of -0.278 and weighted average of $50,321. Similarly, the statistical analysis conducted on geographies consisting of 297,106,472 people shows a weak positive correlation between the proportion of Argentineans and median male earnings in the United States with a correlation coefficient (R) of 0.253 and weighted average of $60,117, a difference of 19.5%.
Median Male Earnings Correlation Summary
| Measurement | Immigrants from Guyana | Argentinean |
| Minimum | $16,923 | $2,499 |
| Maximum | $71,805 | $171,304 |
| Range | $54,882 | $168,805 |
| Mean | $47,916 | $67,306 |
| Median | $49,022 | $61,977 |
| Interquartile 25% (IQ1) | $42,798 | $50,898 |
| Interquartile 75% (IQ3) | $53,585 | $73,533 |
| Interquartile Range (IQR) | $10,787 | $22,635 |
| Standard Deviation (Sample) | $8,575 | $28,973 |
| Standard Deviation (Population) | $8,536 | $28,789 |
Similar Demographics by Median Male Earnings
Demographics Similar to Immigrants from Guyana by Median Male Earnings
In terms of median male earnings, the demographic groups most similar to Immigrants from Guyana are Immigrants from Burma/Myanmar ($50,298, a difference of 0.050%), Osage ($50,292, a difference of 0.060%), Immigrants from Grenada ($50,279, a difference of 0.080%), Subsaharan African ($50,408, a difference of 0.17%), and Immigrants from Ecuador ($50,474, a difference of 0.30%).
| Demographics | Rating | Rank | Median Male Earnings |
| Immigrants | St. Vincent and the Grenadines | 2.3 /100 | #241 | Tragic $50,665 |
| Guyanese | 2.2 /100 | #242 | Tragic $50,613 |
| French American Indians | 2.2 /100 | #243 | Tragic $50,611 |
| Houma | 2.0 /100 | #244 | Tragic $50,547 |
| Hawaiians | 1.9 /100 | #245 | Tragic $50,488 |
| Immigrants | Ecuador | 1.9 /100 | #246 | Tragic $50,474 |
| Sub-Saharan Africans | 1.8 /100 | #247 | Tragic $50,408 |
| Immigrants | Guyana | 1.6 /100 | #248 | Tragic $50,321 |
| Immigrants | Burma/Myanmar | 1.6 /100 | #249 | Tragic $50,298 |
| Osage | 1.6 /100 | #250 | Tragic $50,292 |
| Immigrants | Grenada | 1.6 /100 | #251 | Tragic $50,279 |
| Immigrants | Cabo Verde | 1.2 /100 | #252 | Tragic $50,009 |
| German Russians | 1.1 /100 | #253 | Tragic $49,924 |
| Senegalese | 1.0 /100 | #254 | Tragic $49,774 |
| Alaskan Athabascans | 0.9 /100 | #255 | Tragic $49,748 |
Demographics Similar to Argentineans by Median Male Earnings
In terms of median male earnings, the demographic groups most similar to Argentineans are Immigrants from Bolivia ($60,088, a difference of 0.050%), Romanian ($60,063, a difference of 0.090%), Paraguayan ($59,975, a difference of 0.24%), Immigrants from North America ($60,265, a difference of 0.25%), and Immigrants from Egypt ($59,925, a difference of 0.32%).
| Demographics | Rating | Rank | Median Male Earnings |
| Immigrants | Spain | 99.8 /100 | #67 | Exceptional $60,750 |
| Immigrants | Serbia | 99.7 /100 | #68 | Exceptional $60,600 |
| Immigrants | Canada | 99.7 /100 | #69 | Exceptional $60,388 |
| Immigrants | Bulgaria | 99.7 /100 | #70 | Exceptional $60,358 |
| Mongolians | 99.7 /100 | #71 | Exceptional $60,350 |
| Immigrants | Western Europe | 99.7 /100 | #72 | Exceptional $60,334 |
| Immigrants | North America | 99.7 /100 | #73 | Exceptional $60,265 |
| Argentineans | 99.6 /100 | #74 | Exceptional $60,117 |
| Immigrants | Bolivia | 99.6 /100 | #75 | Exceptional $60,088 |
| Romanians | 99.6 /100 | #76 | Exceptional $60,063 |
| Paraguayans | 99.5 /100 | #77 | Exceptional $59,975 |
| Immigrants | Egypt | 99.5 /100 | #78 | Exceptional $59,925 |
| Immigrants | Ukraine | 99.5 /100 | #79 | Exceptional $59,820 |
| Immigrants | Hungary | 99.5 /100 | #80 | Exceptional $59,806 |
| Ukrainians | 99.4 /100 | #81 | Exceptional $59,728 |